Friday, 3 October 2025

How much are the UK R&D tax credit and Patent Box schemes costing? (Around 7.6 and 2.0 bn in 2023/4)

 1. There are some new figures just out, 30th Sept 2025 (next ones due in a year):  "

Research and Development Tax Credits Statistics: September 2025


here. 

2. "The total support claimed through both R&D schemes for the tax year 2023 to 2024 is estimated to be £7.6 billion (figure 2 and table RD2). This is a decrease of 2% from last year’s total of £7.7 billion."


3. Broadly, the green and purple are SMEs .  The lighter orange/red is large firms. 
4. There is some explaination of these schemes here. Broadly, the RDEC is aimed at large companies, but some small ones claim.  
5. One interesting point is that cloud computing and data expenses are now eligable, since April 2023. As usual ForrestBrown are on top of this.  This is an evolving area, but their broad view is, I think, that cloud computing and data licenceing costs, if they are used in R&D, qualify for relief.
6. it is interesting how. much R&D tax credits have grown, they were around 4bn in 2016.  
7. There is also the Patent Box This costs about £2bn, with 145 companies accounting for 92% of relief. It is very concentrated in manufacturing.  Some excerpts: 

"In financial year 2023 to 2024, it is estimated that the top 145 companies (by the value of the relief they receive each year) accounted for 92% of the relief." 

"
  • in the financial year 2023 to 2024, it is provisionally estimated that 1,650 companies elected into the Patent Box regime. 

  • the value of relief provided under the Patent Box is estimated to have increased to £1,977 million in the financial year 2023 to 2024 from £1,449 million in the financial year 2022 to 2023. This was driven by the change in the main rate of Corporation Tax from 19% to 25% on 1 April 2023

  • of the companies that elected into Patent Box in financial year 2023 to 2024, it is estimated that 28% were classified as ‘Large’ and accounted for most of the relief provided (95%)"


Friday, 26 September 2025

How important are intangibles in accounting for productivity growth?

1. I was asked today: if intangible capital deepening slows, is that a big effect on productivity growth?  This is part of a broader question; what's the relative importance of intangible assets in accounting for productivity growth (value added per hour growth)?

2. Growth accounting allows a decompositition of labour productivity growth into the contributions of:  

a. reallocation = workers moving between industries of different productivity levels 

b. labour composition = increased skills, age and experience

c.  ICT capital deepening = increased ICT capital (computers, comms equip) per hour 

d.  NonICT capital deepening = increased NonICT capital (buildings, vehicles, non-ICT plant) per hour 

e.  Intangible capital deepening = increased intangible capital (R&D, software, artistic originals, design, marketing, business process, training) per hour 

f. TFP = increased total factor productivity (what's left over, which increased efficiency plus mismeasurement etc.)

Here are some results from our EUKLEMS-INTANProd database, in hopefully obvious notation.  Countries are US, UK, EU (France, Germany, Spain, Italy, Denmark, Holland, Austria, Sweden, Finland). Industries are all ommiting A (agriculture), OPQ (defence, education, health), B (mining), D-E (gas, electricity, water), F (construction).  All these are not well measured, and/or mostly public sector. 

As the results show, intangible capital deepening is much the most important contributor to labour productivity growth in the 2011-19 period (tangible capital deepening contributions is the sum of ICT and NonICT, which is still lower than the intangible contribution).

Table:  of contributions


And a picture


As we saw in a recent blog the employment rights bill will very likely lower intangible investment. That will lower intangible capital deepening, other things equal.  This then is a policy measure lowering the major source of UK productivity growth.  Not a good policy if you want growth to increase. 

What has happened to R* recently?

 The 2025 Brookings Papers conference had a sesssion on this.  

The slides from Lukasz Rachel and the discussants are available. 

The discussant Adrien Auclert makes some very nice points. I picked up on some.


First, the framework.  R* is the price that balances demand for capital for use in production by firms with the supply of savings by consumers.  But terminology is hard here: the savings by consumers causes them to build up wealth, which is in part demand for durable assets (e.g. a house).  So wealth accumulation is asset demand which is capital supply.   And the demand for the use of capital is by firms and governments to produce goods/svcs, and they issue claims on the owernship of such assets e.g. shares (and for government, government debt).  So the value of assets issued by firms and government is asset supply or capital demand.  This is nicely illustrated by his graph which highlights the demand/supply nomenclature 


Thus he talks nicely about forces that raise asset supply which raise r*


And forces that raise asset demand, which lower r* 


He summarises the main finding of the paper as being that asset demand has won


with the main drivers falling productivity, rising aging and rising risk


Here is the prediction for the future


most of these are putting upward pressure on r*, but intangibles are lowering. why? this is because in his model more intangibles offset competition and innovation and so lower productivity.  

Thus we have

1. business as usual, small and gentle fall in r*

2. more productivity growth, r* rises. 


Wednesday, 17 September 2025

A portrait of UK R&D

 Getting a handle on innovation support is hard with many schemes, funding etc.  Just looking at R&D, here is some data from Cambridge UK Innovation Report, 2025, using the latest 2022 data.


1.  Spending on R&D, excluding tax credits looks like this: where the Sankey diagram nicely shows the potential difference between an intangible asset that can be financed in one area and have the performed investment be in another place: 


(btw, within UKRI are a number of other institutions; research councils (competitive grants allocation, about 50% of the money: innovateUK(working with companies to derisk innovation, catapult centres etc. about 20% of the money).  HEFCE/Research England give out REF-based money to universities.  See here,). 

.  

2.  What does business spend the R&D money on (notice these are products and not industries)?  Notice the massive figure on software development; and notice too the seperate line for computer programming and info services.  The days of R&D being mostly pharma and transport are over. 


3. Finally, notice too that government support for R&D can also be tax credits.  They are much more than direct funding as the below shows:


4. and the figures for tax credits are very large; £7.5bn in 2022-3 "For the 2022–23 tax year, UK businesses claimed a total of £7.5 billion in R&D tax relief support. This figure is more than twice the £2.6 billion of direct support to business R&D provided by the government and UKRI in 2022" 


By size "In terms of R&D tax credit claims by firm size in the UK, in the 2022–23 tax year:[2] • 67% (US$5 billion) were claimed by small and medium enterprises • 33% (£2.5 billion) were claimed by large firms." 


Did persisently low interest rates post GFC lower productivity growth?

Many allege that the long run of low interest rates post global financial crisis lowered productivity growth via zombie firms.  These low productivity firms survived more than they should have done and hence productivity growth stalled.  

An alternative view is that low productivity growth, for other reasons, lowered r* and hence interest rates.  

A paper "Aggregate productivity decompositions using structural business surveys: Evidence from the UK by Russell Black, Rebecca Riley and Garry Young", available here sheds a bit of light on this for the UK.

It uses UK company data to decompose productivity growth into that 

a. within surviving companies

b. reallocation of market share between surviving companies

c. the net effect of exit and entry.

One might think that the zombie firms view would say that the net entry/exit effect would be less as fewer low productivity firms exit.  

Their chart shows this isn't the case.


1. Using various different methods the change in the net entry effect, see middle panel is very small, a slight fall.

2. instead, the fall in productivity growth is due more or less equally to falling within firm growth and falling between firm reallocation.  The latter might be a zombie phenominon, but it isn't clearly so.


Update, with some numbers
1. using the Foster. Halitwanger, Krizan decomp, the 5 year interval, 99-07, within effect is 1.95%, net entry 0.22% (total LPG is 1.4).  The same data, 2011-19 are 0.61%, 0.08% (-0.32%).  

2. so the net entry effect has slowed, but it's 8% of the slowdown.  The change in within effects are 80% of the slowdown.

Monday, 1 September 2025

Rates of return, net present values and cost-benefit ratios

 1. suppose the government spends £x on some investment, say a road or R&D.  What is the rate of eturn/ 

2. Following some excellent notes from the OBR, we have that the IRR of that spend is the discount rates that solves the equation

 Title: N P V equals sum from n equals 0 to infinity of B over open parentheses 1 plus r times close parentheses to the power of n minus x equals 0

 - Description: {"mathml":"<math style=\"font-family:stix;font-size:16px;\" xmlns=\"http://www.w3.org/1998/Math/MathML\"><mi>N</mi><mi>P</mi><mi>V</mi><mo>=</mo><munderover><mo>&#x2211;</mo><mrow><mi>n</mi><mo>=</mo><mn>0</mn></mrow><mo>&#x221E;</mo></munderover><mfrac><mi>B</mi><msup><mfenced><mrow><mn>1</mn><mo>+</mo><mi>r</mi><mo>&#xB7;</mo></mrow></mfenced><mi>n</mi></msup></mfrac><mo>-</mo><mi>x</mi><mo>=</mo><mn>0</mn><mspace linebreak=\"newline\"/><mspace linebreak=\"newline\"/></math>","origin":"MathType Legacy","version":"v3.19.0"}

 that, is the rate of return that sets this number to zero.

3. the Benefit from spending on some investment is more GDP.   That increase in GDP is dY/dK.=alphaY/K where alpha is the elasticity of output with respect to capital.  If Y/K is constant and we imagine spending £1 investment we have 


which says that the IRR is the marginal product of the project less the depreciation rate.  Or, the marginal product of the product is the gross rate of return. 

Wednesday, 13 August 2025

AI and productivity

Martin Baily, Erik Brynjolfsson and Anton Korinek offer a calculation that is more subtle than you might think.  They say 


"The first channel is the increased efficiency of output production. By making cognitive workers engaged in production more efficient, the level of output increases. Economic theory tells us that the effect of a productivity boost in a given sector on aggregate productivity and output is equal to the size of the productivity boost multiplied by the size of the sector (Hulten’s theorem). For instance, if generative AI makes cognitive workers on average 30% more productive and cognitive work makes up about 60% of all value added in the economy (as measured by the wage bill attributable to cognitive tasks), this amounts to a 18% increase in aggregate productivity and output."

The second channel?

"The second channel is the acceleration of innovation and thus future productivity growth. Cognitive workers not only produce current output but also invent new things, engage in discoveries, and generate the technological progress that boosts future productivity. This includes R&D—what scientists do—and perhaps more importantly, the process of rolling out new innovations into production activities throughout the economy—what managers do. If cognitive workers are more efficient, they will accelerate technological progress and thereby boost the rate of productivity growth—in perpetuity. For example, if productivity growth was 2% and the cognitive labor that underpins productivity growth is 20% more productive, this would raise the growth rate of productivity by 20% to 2.4%. In a given year, such a change is barely noticeable and is usually swamped by cyclical fluctuations, but productivity growth compounds. After a decade, the described tiny increase in productivity growth would leave the economy 5% larger, and the growth would compound thereafter. If the acceleration applied to the growth rate of the growth rate as well, then of course, growth would accelerate even more over time."

Let me focus on the first channel.  What is Hulten's theorem?  This is an obvious point, but solved by a brilliant piece of economics.  Quoting from Hulten's paper, Growth Accounting with Intermediate Inputs, Charles R. Hulten, The Review of Economic Studies, Volume 45, Issue 3, October 1978, Pages 511–518, https://doi.org/10.2307/2297252.  


1. ...Productivity change is conventionally defined as the residual growth of real product not

accounted for by the growth of real factor input.

2. but, some inputs are themselves outputs of the productive process: capital and intermediate input. Increased factor efficiency will, in general, lead to increased output, and thus to increases in the quantity of produced inputs available for production.

3. In any post-mortem assessment of the sources of growth, this induced expansionin produced inputs must be recognized as having been the result of productivity change. That is, the growth rate of total factor productivity must be adjusted for the additional input available as a result of the increased factor efficiency. 

4.The present paper studies the interaction of productivity change and intermediate input

What he shows is the link between industry TFP growth in an industry, j, and overall TFP growth, taking account of the induced extra intermediates from TFP in the industry. This is 

TFPG, agg = (PgG)j/(PvV) * TFPGj, industry of gross output


where the TFPGj is the gross output of industry j. The multiple is ratio of gross output in industry j, divided by total value added in the economy.  This multiple adds to something greater than one, but that makes sense, since TFPG in j "spreads out to other industries". 

Finally, what of the above calculation?  If AI is labour augmenting, then it raises the productivity of labour in industry j.  Thus it raises TFPG in j by the share of labour payments in gross output of industry j.  Thus the overall effect, for AI that is labour augmenting, is the labour payments in industry j over total value added, times the labour-augmenting technical progress.  This is how they end up with 60% times 30% over the years it will take to realise the gains.


Tuesday, 29 July 2025

Which industries do the most R&D? Some suprising US data...

 I was always of the view that R&D was concentrated in a few manufacturing industries: chemicals (including pharma), computer manufacturing and transport equipment (planes, cars etc.).  Not any more.  The  US data  in "Research and Development: U.S. Trends and International Comparisons, NSB-2024-6, May 21, 2024, tells the story.

It's information, in particular R&D into software.  Data from the US shows the below 


 and the accompanying text shows the importance of information (the dark blue line above):


The rest of this section focuses on R&D activities by businesses with 10 or more domestic employees from the NCSES BERD Survey. Five industries accounted for 79% of the $602.5 billion of U.S. business R&D performed by these companies in 2021: information (including software publishing) at 25%; chemicals manufacturing (including pharmaceuticals and medicines) at 18%; computer and electronic products manufacturing (including semiconductors) at 17%; professional, scientific, and technical services (including R&D services) at 11%; and transportation equipment manufacturing (including motor vehicles and aerospace products and parts) at 8% (Figure RD-12; Table RD-6).16 Machinery manufacturing companies performed another 3%.


At the four-digit NAICS level, the industries with the largest R&D intensities were scientific R&D services (41%), semiconductor and other electronic components manufacturing (20%), pharmaceuticals and medicines manufacturing (16%), and software publishers (13%)."


The report continues:


"Software R&D, over half of which is performed in the information services industry, is an increasingly large

technology area of U.S. business R&D expenditures. In 2021, software R&D accounted for $257.0 billion, or 43% of $602.5

billion. In 2021, a separate 5% ($28.9 billion) was classified by businesses as R&D specifically devoted to AI

applications."


That's a staggering number. To repeat from the table, 42% of US R&D spending is on software products or embedded software in the R&D.  See the table below.  Of the manufacturing sector's spend of 326bn, 50bn is on software or related. 


Finally, a useful cross-section snapshot, including the R&D/sales ratio


notes: a Dollar values are for goods sold or services rendered by R&D-performing or R&D-funding companies located in the United States to customers outside of the company, including the U.S. federal government, foreign customers, and the company's foreign subsidiaries. Included are revenues from a company’s foreign operations and subsidiaries and from discontinued operations. If a respondent company is owned by a foreign parent company, sales to the parent company and to affiliates not owned by the respondent company are included. Excluded are intracompany transfers; returns; allowances; freight charges; and excise, sales, and other revenue-based taxes.
b Domestic R&D is the cost of R&D paid for and performed by the respondent company and paid for by others outside of the company and performed by the respondent company.


Update. 
Here are the comparable UK figures on a product basis. I take this from "expenditure on R&D performed in UK businesses: detailed product groups.  2023, from here.  


on Industries, we have 
62. Computer  progr, consultancy and related = 13% 
72. Scientific R&D 25%
21. Pharma mfring 0.9%
26. computer mfring 3.8%


Friday, 25 July 2025

Computing in the Cloud

 I hadn;t seen this study untile now.  Cloud services market study, Final report. from Ofcom. 

Some things I took away.

"‘Cloud computing’ is the provision of remote access to computing resources (such as compute, storage and networking) on demand and over a network. "

 "Cloud infrastructure provides the foundation for how software applications are developed and run. This consists of products called infrastructure as a service (IaaS) which includes storage, computing and networking, and platform as a service (PaaS) which includes the software tools needed to build and run applications. The market for cloud infrastructure in the UK was worth £7.0 billion to £7.5 billion in 2022. There are two leading providers of cloud infrastructure services in the UK: Amazon Web Services (AWS) and Microsoft, who had a combined market share of 70% to 80% in 2022.2 Google is their closest competitor with a share of 5% to 10%. Collectively these firms are referred to as the ‘hyperscalers’ and the vast majority of customers use their cloud services in some form. A diverse set of independent software vendors (ISVs) build their products on cloud infrastructure from the hyperscalers, but also compete directly with some of their services."

"Our study has found that competition between cloud providers is mainly focused on attracting new customers when they first move into the cloud. We see evidence of some positive outcomes for customers, including product innovation, discounts and a wide choice of software services from ISVs. However, our view is that competition is being limited by market features that make it more difficult for customers to switch and use multiple suppliers (known as ‘multi-cloud’). " 


My comment.  A nice example of competition for a market (very intensive) and competition in a market (once you are signed up, not intensive).  Regulators, in my view, have to be very careful here. If they try to have more competition in the market e.g. lower switch costs, you might hurt the bargains available in the competition for the market. Futhermore, it turns out that at least some customers can multi-cloud host. 

Here are some examples of the benefits of competition for the market.

"1.13.  This means competition between the hyperscalers is mainly focused on attracting new customers into their ecosystems when they first move into the cloud. Significant discounts are offered in return for committed spend by larger customers, alongside technical support to help businesses move applications into the cloud. 

1.15 There are indications that competition for new customers is leading to some positive outcomes. Providers are investing in their offerings to match product development by their rivals and we see some evidence that they are responding to customer demand for opensource technologies, for example by adopting containers.4 Customers also have access to a diverse range of services from ISVs, including some that meet very specialist use cases, that are developed and run using cloud infrastructure as the foundation." 


More interestingly, what does this market actually do? 

3.5 Traditional IT infrastructure is made up of data centres, servers, networking hardware, desktop computers and applications. It is usually installed on-premises for private use by an organisation. It is usually connected to a network which includes stored data and applications. Organisations relying on traditional IT infrastructure normally depend on an in-house IT department to install and maintain the infrastructure

3.2 In this market study, we define cloud computing as the provision of remote access to computing resources (compute, storage and networking) on demand and over a network (public internet or a private connection), instead of a personal computer or local server that are not part of the cloud.

3.6 Compared to traditional IT infrastructure, cloud computing offers flexibility and scalability which enables customers to quickly scale up or down the computing resources that support their business. This can allow them to reduce their IT costs, transform capex into opexincrease their innovation potential, enhance their quality of service, and achieve baseline security and resilience. It also offers access to relevant data from any device, anytime and anywhere.

3.7 While cloud computing offers significant benefits, it does have some limitations. Cloud infrastructure is usually owned and managed by the cloud provider, so the customer may have more limited control over their data, applications and services. Furthermore, public cloud computing is completely reliant on internet connection, so if the connection is interrupted, data cannot be accessed.

3.8 The main suppliers of cloud services (all services involved in the provision of cloud computing) in the UK are Amazon Web Services (AWS), Microsoft and Google,51 which offer a broad range of cloud services at scale and are often referred to (in this document and more widely) as the hyperscalers.


The different service models are interesting. 

3.15 Cloud services provide access to computing resources on demand, via a network. The customer buys access to the computing resources as a service and typically does not own the underlying hardware and software. There are three key elements to this definition:

a) Computing resources – these include hardware (servers and network equipment) and software (applications) which are used to process workloads65 and store data.

b) On demand – the computing resources are available on a scalable and elastic basis. This typically involves the dynamic provision of virtualised computing resources. Users are often billed for the amount of resource used.

c) Via a network – the transit of data to and from the cloud provider may be over the public internet or a private connection. This allows location-independent access to the cloud.


And here are the models

3.17 Cloud services are typically classified according to their service models: infrastructure as a service (IaaS), platform as a service (PaaS) and software as a service (SaaS). 

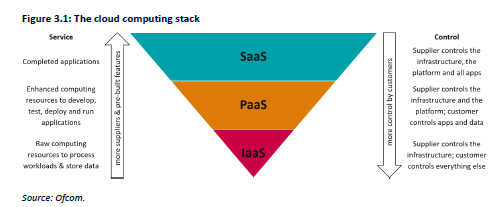
3.18 The service models are differentiated by the level of control the customer has over the management and maintenance of the computing resources. IaaS, PaaS and SaaS form a vertical stack, where each layer is notionally built on top of the previous one(s). This is shown in Figure 3.1 below.


3.19 Infrastructure as a service (IaaS) are cloud services that provide access to raw computing resources for processing workloads and storing data. Examples of IaaS include AWS EC2, Microsoft Azure Virtual Machines and Google Compute Engine

3.20 Platform as a service (PaaS) are cloud services that provide access to a virtual environment for customers to develop, test, deploy and run applications. Examples of PaaS products include AWS Elastic Beanstalk, Microsoft Azure DevOps and Google App Engine – which can be used, for example, to build streaming video on demand (SVoD) services

3.21 Software as a service (SaaS) are complete applications hosted in the cloud. In general, most modern consumer and business facing applications are SaaS, including communications services (e.g. Gmail and WhatsApp), broadcasting video on demand (BVoD) services (e.g. BBC iPlayer), productivity software (e.g. Microsoft Office 365 and Google Workspace) and customer relationship management software (e.g. Salesforce Sales Cloud).


The completeness of this is nicely set out 


What has been happening to prices? Parat 4.124 is mostly redacted, but some points. First, list and transactions prices seem very different. Second, some data: para 4.128 "For EC2, the average UK list price across instance families fell by almost 30% between 2016 and 2022 (but a large price reduction between 2016 and 2017 means that prices fell by less than 15% between 2017 and 2022)."


Wednesday, 25 June 2025

QE, QT and interest on reserves

 The Bank of England governor has written a very good letter after a reform MP suggested not paying interest on reserves. My thoughts.


1. Paying interest on reserves

a. reserves are accounts held by banks at the Central Bank (CB).  They are an immediate source of liquidity.  they have two purposes

    i. Monetary policy. the CB pays Bank Rate on those reserves overnight.  So they are the base of the pyramid of more long-term interest rates.  As the govneor says 

"Over time, we have been able to demonstrate that this approach reduces interest rate volatility at the short-end of the interest rate curve, and thus improves the efficiency of implementation of monetary policy, with real benefits for the economy as a whole."

    ii. Financial stability.  They are "what are called High Quality Liquid Assets (HQLA). Assets such as gilts and other high-quality debt also qualify as HQLA".  So if a Bank needs cash, it can sell these assets immediately.  Remember: banks lend long and borrow short from depositors.  So they are always potentially needing short term cash if their depositors suddenly want their money.


b. What is the optimal level of reserves? The CB could hold very few, like pre-07.  But that was unstable, so for financial stability reasons, better to have large.  But it's a free country


It follows that the overall level of reserves is driven by our financial stability objective rather than the monetary policy objective. However, it also follows that, as the overall regulatory requirement for banks is set in terms of high-quality liquid assets that can be readily converted into cash if needed, there is no requirement specifically on reserves. So, in steady state banks have choices over the amount of reserves they wish to hold.

c. Thus: what determines the demand for reserves? Or, how can the CB get banks to hold reserves?  Two answers, 

    i. by paying interest. 

    ii. by mandating resserve levels.  But this in effect freezes money so bad for lending.  

d. So the Bank has to pay interest.  And in a competitive banking sector, that interest is passed onto depositors: or, depositors give commercial banks their money after which commerical banks have to decide what to do with it, one of which would be giving it to CBs.  So not paying interest is like a tax on banks which is likely ultimately a tax on depositors.  Fine, but that's a fiscal policy decision.

e. What about QE and QT? This is when the Bank holds more reserves than necessary for the above arrangements.  In the absnce of that, the costs/benefits are neutral.  Why is that?  The Bank pays interest on reserves.  But the Bank owns bonds and so gets interest in.  As Jochn Cochrane says, see link below,  usually long term debt pays more than short term debt, so this works out. 

(f. note a good Blog by John Cochrane on paying reserve interest: a few points he makes

"One reason given is that it would save the government money... In addition, interest on reserves is paid to a lot of foreign banks, and sending foreigners money so they can buy American goods is somehow out of fashion.

One answer: If you think that is a good and reasonable idea, here is a better one: stop paying interest on all Treasury debt. Reserves are just another form of government debt, so why stop there? That will generate $1 trillion per year, not in 10 years or so. And lots of foreigners hold Treasury debt too."


2. QE and QT

As the letter says: 

"QE involves a different state of the world, where the central bank buys financial assets, thereby increasing the prices of these assets and reducing their yield. It thus has the effect of flattening the yield curve benefitting those who borrow at long maturities." 

Let's unpack this.  If you look at the vote that the MPC votes on it is the purchase of government bonds (gilts) by the issuance of CB reserves.  That is, it is using reserves which pay a Bank Rate to buy gilts. This is swopping short dated financial assets for longer dated ones. 

As the letter then says

"You have challenged the Bank’s approach to QT and whether it represents value for money. There are two main ways to look at value for money here, and it is important to keep them distinct. One – which fits the Bank’s statutory objectives – is to look at the economic costs and benefits and how they fit the Bank’s two objectives. The other is to look at the cost in terms of cash flow and the public finances, which is outside the Bank’s objectives but something that I recognise is important" 

Then, righly it adds 

" The first test is important but challenging. It requires a full set of alternative economic scenarios going back to 2009 when QE started and modelling what would have been the state of the economy in the absence of QE and QT. We have experienced major economic shocks during this period – the aftermath of the financial crisis, Covid, Ukraine. It is easy to forget the severe problems we faced with these shocks. Although the counterfactual is unknowable with any precision, most estimates indicate that QE provided very significant support to the UK economy, protecting both jobs and tax revenues.


"Your focus though is on the second test. Here, it is important to consider cash flows, as you indicate, and moreover the impact on the overall public cash position. While QE was being used as an active policy tool, and interest rates remained low, the cash flow was positive, totalling £124bn that was transferred from the Bank to the Exchequer between 2013 and 2022. Once interest rates increased, the cash flow started to reverse, something the Bank had said since the start would happen. Today the net positive cash flow stands at £34bn, but we expect it to go negative over the remaining lifetime of the policies on this basis of calculation."

Remember too that timing is unimportant, which is why stable and predictable is key

" An important point to bear in mind here is that we ought to expect that the cash flow will over time be the same regardless of whether we sell the assets or hold them to maturity. This is because the price discount on an active sale is simply equal to the present discounted value of the carry cost that would be incurred were the assets held to maturity. The timing of the cashflows, but not their overall size, is affected by whether or not there are active sales. By avoiding disrupting markets, our gradual and predictable approach to QT supports this."

That's the essence of the argument, but it continues with a detail concerning the cash flow, even though this isn't part of the Bank's objectives.

"But this is not the end of the story, though it is the end in most of the accounts of the cash flows expected. An important missing element is that successive UK Governments have issued more long-term debt (gilts) than those of other major economies. The average term of outstanding UK Government debt is around 14 years, compared to around 6-7 years in, for instance, the US, Germany and Canada. The Bank’s policy throughout QE was to buy equal amounts across the maturity distribution of gilts, to ensure that our operations were neutral for the gilt market. This means that the Bank now owns more long-term gilts, something that helps to explain why we are conducting more active sales (as we have a slower path for natural maturities). A consequence is that, with an upward sloping yield curve, we do have larger discounts (and would otherwise have larger carry costs) on our long-dated gilts. This has led some commentators to suggest that the Bank’s QT programme is more expensive than those of other countries

 What does this mean? The Bank bought lots of long dated gilts.  So, the Bank has a stock of lots of low coupon paying long dated gilts, which can only be sold to the market, now that the yield curve has risen, for a very low price i.e. at a losss.  So it looks like the QT programme is "expensive" since there are lots of capital losses.

But there is a counter-argument.  

"Because it issued much more long-term debt than other countries when interest rates were low and QE had flattened the yield curve, the UK gets a longer lasting benefit in the form of lower debt costs.

I must emphasise again that these cash flows are not a part of our objectives, but I recognise that we must, and do, have regard to value for money."