Tuesday, 25 February 2025

Trade and Trump

 A brilliant podcast with Martin Wolf and Richard Baldwin.  "

Martin Wolf talks to Richard Baldwin: What’s the future of global trade?

Is technology making tariffs redundant?


Richard makes some brilliant points.

1.      There are three phases of globalisation: All of which are essentially the separation of the production of commodities from the consumption of commodities.  Food is an obvious example. 200 years ago a large fraction of the British population worked on the land. Now, hardly anybody works on the land yet we managed perfectly well to feed ourselves.

2.      The first phase was trade in goods.

3.      The second phase was trade in production.

a.      In the second more subtle phase what happened was there was a massive outsourcing of production mostly manufacturing to low wage countries Who were much more competitive at labour intensive tasks.  We we are now in a position as a consequence of this the China manufacturers around 30% of world manufacturing. Unscrambling this of course will be quite painful, and notice that much of this manufacturing is in turn intermediate goods which go to other countries.

b.     The fact that so much of this is intermediate goods is an important consequence for Mr trump's tariffs. In the early days of the USA The US manufactured hardly anything and imported vast quantities of goods. Tariffs on goods therefore raised an awful lot of money, at some cost of course to the living standards of American consumers.  Now with so much trade in intermediate goods putting a tariff on an import is simply punishing yourself.  Baldwins view is that ultimately this economic logic will mean that the worst of tariffs will be watered down.  He also pointed out interestingly that Biden was much more selective in his use of tariffs, for example on semiconductors, perhaps to build up US manufacturing capability for national security style reasons. Noah Smith has also put forward this interpretation.

4.      The third phase is yet to come, and that is trade in services. Or as Martin wolf puts it dramatically, we started with trade in goods, then we had trade in factories, now we have trade in offices.

a.      One point about service sector trade is that it's very difficult to put a tariff on it. If somebody in India helps me with my PowerPoint slides it's almost impossible to put a tariff on that. Likewise as they point out, since Richard Baldwin is sitting in Zurich, the podcast they were making is in fact (nonmonetary) trading services. Impossible to know how one could put a tariff on that.

b.     They then make the point that such trading services is potentially competition for a lot of middle class jobs. Martin wolf made the point that radiographers elsewhere in the world can probably look at X-rays perhaps better then native radiographers.

c.      It further follows that once machines get even better at doing all of this then trade is possibly only a secondary force.

d.     On a slightly more technical issue, Richard Baldwin made a very nice point about the OECD services trade restrictiveness index. The interesting point about this index is it shows a lot of variation across countries, when it seems very hard to actually Put tariffs on services. Richard Baldwin made the very nice point that this restrictiveness index is essentially an index of the difficulty of business to consumer trade. Much of services trade however might be business to business trade, which is not captured by the index.

Martin Wolf talks to Richard Baldwin: What’s the future of global trade?

Is technology making tariffs redundant?

Martin Wolf talks to Richard Baldwin: What’s the future of global trade?

Is technology making tariffs redundant?


Wednesday, 19 February 2025

Defence spending: getting a sense of the numbers

 1. If we have to spend more on defence, what is the scale of those numbers?

2. The ever brilliant IFS have a "what does the government spend money on" guide. 

3. The picture is this: 


4. and the (round) numbers are this. 

5. Total spending 22-23 is £1,200bn.  We have (again in round numbers)

   a. NHS spending: 200bn = 20% of total

b. Education: 100bn = 10%

c. Defence 50bn = 5% 

d. Public order = 40bn, 4%

e. Transport 40bn = 4%

f. net debt interest 100bn, = 10%.


6. Total GDP in 22-23 was 2.6tr. So 1% of GDP is 26bn, 0.1% of GDP is 2.6bn (a basis point of GDP is 260m).  If we currently spend 2.3% of GDP on defence and want to increase that to 2.5% of GDP, that is a rise of 0.2 pp of GDP whiich is about 5bn.  That's about 12% of transport or public order, or 5% of Education. 

Friday, 7 February 2025

Do monetary incentives crowd out pro-social behaviour

 1. This has always struck me as a potentially important critique of standard economic assumptions.  The ever brilliant Chris Dillow notes this is a problem with using market mechanisms.  As he says


This problem is exacerbated by another: motivation crowding out. Who is likely to be the better probation officer: the one drawn to the profession by a desire to rehabilitate offenders; or one who will earn a little more for hitting a contractual target? Who is likely to better look after vulnerable children: someone attracted to work in childrens' homes by a love of children; or one working for a profit-maximizing private equity firm? If the cash nexus comes to dominate, other motives such as professional pride recede not just because people change but because those with strong professional ethics simply leave the job.


2. The paper he links to is Bowles  and Reyes.  They nicely use a Lucas critique argument

"Here we extend the logic of the Lucas Critique to questions of framing, motivations, and social norms, in short, to preferences. To do this we modify the standard public economics and mechanism design assumption that taxes, subsidies, and other explicit incentives affect behavior only indirectly, that is by altering the economic costs and benefits of the targeted activities. In this conventional approach explicit incentives thus do not appear directly in the citizen's utility function and as a result, the behavioral effects of explicit economic incentives and social preferences are separable, the effects of each being independent of the levels of the other. We modify the citizen’s utility function so that this separability property need not hold and as a result the two kinds of motivations may be either complements -- social preferences being heightened by incentives appealing to self-interest -- or substitutes, when explicit incentives are said to crowd out social preferences." 

As they say there may be other reasons 

 Incentives may have counter-intuitive and counter productive effects for reasons other than non-separability (Seabright (2009)).


Strong monetary incentives, for example, may overmotivate an agent leading to greater than the optimal level of arousal posited by the so called Yerkes-Dodson law. This appears to be the mechanism underlying the negative effects of high incentives found in three experiments by Ariely, et al. (2005).


Similarly, if agents have an income target, monetary incentives may allow target attainment with less effort. Camerer, et al. (1997) suggest that this may explain why New York City taxi drivers work fewer hours when they are making more per hour. 

and they add the possiblity that just setting a target might signal how hard the achievement is:


the target may also infer information about the person who designed the incentive, about his or her beliefs concerning the target, and the nature of the task to be done (Benabou and Tirole (2003), Fehr and Rockenbach (2003)).


3. Dillow's earlier blog post on Ronnie O'Sullivan is a fantastic summary.  


Monday, 3 February 2025

Intangibles and Industry Concentration

 Very pleased to see this article.  Why has industry concentration risen? Because of intangibles....

Intangibles and Industry Concentration: A CrossCountry Analysis

 Matej Bajgar, Chiara Criscuolo, Jonathan Timmis


"This paper presents new evidence on the growing scale of large businesses in the United States, Japan and 11 European countries. Itdocuments a broad increase in industry concentration across the majority of countries and sectors over the period 2002–2017. Therising concentration is strongly linked to investment in intangibles—particularly innovative assets; and software and data—andthis relationship is magnified in more globalised industries. The results are consistent with intangibles disproportionately bene-fiting large firms, enabling them to scale up and increase their market shares by leveraging intangibles across multiple markets." 


Here's the key chart


Wednesday, 29 January 2025

UK Intangible investment: ONS data

 1. The ONS has estimates of UK intangible investment 97-02 : Investment in intangible assets in the UK: 2022 with data here: 

Investment in intangible assets in the UK


2. if we start by industry we have: 


Showing that these data are for what I call for short-hand the "business" sector, i.e. excluding L, real estate and O/P/Q, public admin, defence, health, educatoin.  

3. to get a sense of scale, what is GVA for these sectors? the ONS Blue Book, 2024, industry analysis, has this graph


with the underlying data here.  This gives totdal GVA= 2.265
tr, Govt = 0.433tr, Real estate = 0.292tr => business sector = 1.539tr  = 68% of total GVA (govt = 20%, real estate 13%).  

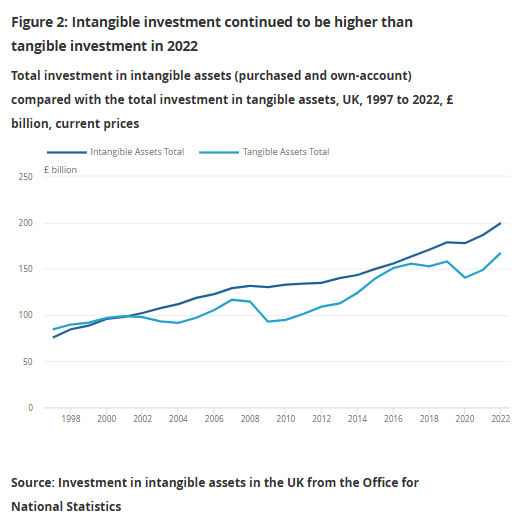
4. Returning to intangibles we have in 2022: tangible investment  = 167.3£m, intangible 199.7bn, of which £77bn is capitalised and £122 is not.  That gives 5% capitalised intangible/GVA and 12% total/(GVA+uncapitalised). 

5. the industry intangible intensities are below.  ICT, Manufacturing, finance and the arts are intangible intensive.


6. Finally, in comparing with tangibles we have intangibles higher than tangibles


with the 2022 figures being 199/(1539+122) = 12% and 167/(1539 +122)=9%.  (or for capitalised, 77/1539 = 5% and 167/1539 =  11%). 

Building new infrastructure: getting a sense of scale

 The Chancellor is going it seems to announce backing for new infrastructure today.  For example, a new runway at Heathrow might cost £14bn (see Tim Leunig's excellent substack: https://timleunig.substack.com/p/how-to-fund-heathrows-expansion) .  Is that a lot or a little?

1. the official ONS capital stock data are hereDataset Capital stocks and fixed capital consumption  and the publication using the data is here: Capital stocks and fixed capital consumption, UK:


2. Here are the data for 2023


Note to table: Some definitions are: “Other buildings consist of all buildings that are not dwellings and include commercial buildings, industrial buildings, and buildings used to provide public services (for example, schools and hospitals). Other structures include those that are not buildings; for example, transport (roads, railways, runways, ports), energy and communications infrastructure.” (https://www.ons.gov.uk/economy/nationalaccounts/uksectoraccounts/articles/improvingestimatesoflandunderlyingotherbuildingsandstructuresinthenationalbalancesheetuk/2022). 

3. As the table shows

    a. around 75% of the captial stock are buildings of various types.  

b. the total value of the UK capital is 10,751 billion.  If a third runway, which is a huge project, costs £14bn, that's an increase of 0.13% of our nation's capital stock.  

Tuesday, 14 January 2025

The Creative Industries

 I often struggle to remember who is in and out of the official definition of the creative industries. Here is the table:


And the source of all this is here: taken from the DCMS Sectors Economic Estimates Methodology


Thursday, 9 January 2025

India's growth success: log scales in action

 In class we have spent a lot of time saying how informative log scales are. Here's a perfect illustration from Martin Wolf in the FT. 

1. The main story is : An economically dynamic India is Manmohan Singh’s greatest legacy. He drove radical reform of an anti-market policy regime that was strangling growth. Link

2. "Singh’s most important achievements as a policymaker were made during his years as finance minister from 1991 to 1996. "

2. How do we see that in the data?  Notice the log scale allows us to read off the growth rate break from just that time.


4. and here by contrast is the data on a non-log scale: which fools you into thinking it's a post-2000 effect.


Addition: applying the rule of 72 to the growth rates in the FT graph, we have that before Singh it takes 72/1.6=45 years to double GDP per head, after 72/5.2=14 years. 

Saturday, 4 January 2025

Visual summary of our work on intangibles

If you'd like a beautiful visual summary of some of our work on intangibles, do look at this amazing graphic storyboard from The Beautiful Truth

The magazine is at this link. The graphics are fantastic.