This expands on today's earlier post.
How much extra output do we get if we invest more?
How much extra output do we get if we invest more? Here’s
some rules of thumb.
1.
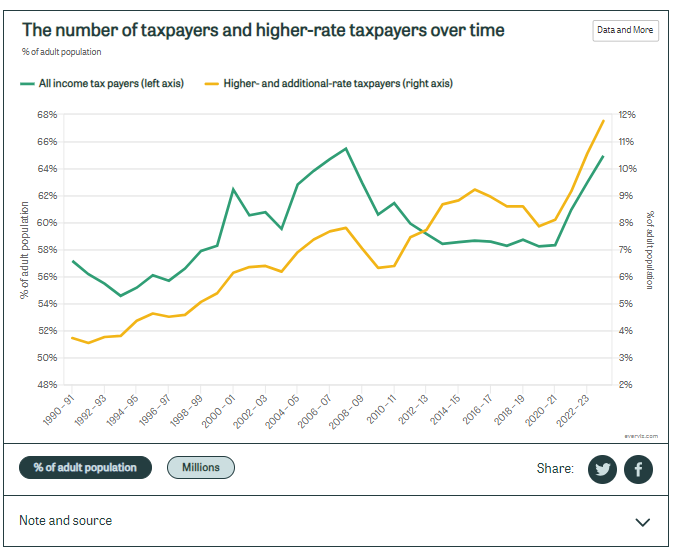
From the RF growth
mindset report, some useful data as background.
2.
Here’s our underperformance relative to the G7

3.
And here it is in bars:

4.
So we might regard our target is
a.
To get the US GDP per capita growth rates, we
need another 1.55-1.03 = approx 0.5% growth per year.
b.
Notice that’s relative to the USA, relative to
EU would be much less than that.
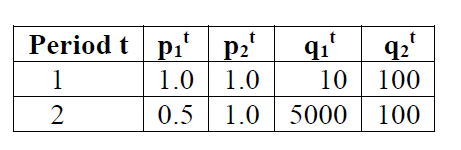
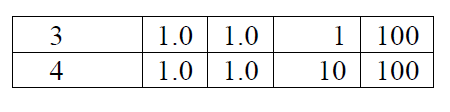
5.
How can we get to this via capital investment? Here’s the tyranny of numbers.
6.
The extra output from 1 extra unit of capital sounds
like an engineering problem. But we can
use some economic reasoning to get some measures.
7.
The average rate of return on capital is about
0.10 as measured by the ONS. That says
that the flow of profits from the existing capital stock in the UK, as a percentage
of that capital stock, is just below 10%.
8.
Let’s take a concrete example to check this. In Feb2024, according to IBA
Aero, the price of a new A320neo was $52m.
The monthly rental cost was $400,000.
This ratio is 9%. So that says
that airlines are incurring a cost of renting a new aircraft that is 9% of the
capital stock they would have to buy.
9.
If we further assuming that airlines are maximising
profits, then they would rent more and more aircraft until the extra flow of output
they can sell from renting another aircraft were equal to the extra costs. But we have just worked out the extra costs are
8%.
10.
That gives us part of the answer: for every
increase in capital stock by one unit, output rises by 0.08 units (0.1 units for
the economy as a whole)
11.
It’s more helpful to convert that into a
percentage. We can do this if we express
the change in output following a change in capital, the 0.1, as a proportion of
the baseline output/capital ratio. That ratio,
for most developed economies, is around 3.
12.
Thus we have the following:
a.
Average rates of return are around 0.1. This tells us the extra output from one more
unit of capital.
b.
Average output/capital is 3.
c.
So the percentage extra output from a one
percentage extra capital is 0.1/3 = approx. 0.3.
13.
What percentage rise in output do we get from a percentage
rise in capital then? For the economy as
a whole the rule is
% rise in output from x% rise in capital asset A= 0.3 *
share of capital asset A in the economy * % change in capital asset A.
14.
Let’s apply this rule to housing. It is planned to raise housing input by
0.3%. Housing is 40% of the total
capital stock. Thus the expected % rise
is 0.3*0.4*0.3% =0.036%.