Friday, 25 September 2015

What is R&D?

The tax authorities need to know the answer to this question to give a credit. So what do they say?
If you go to HMRC website to "Which costs qualify for R&D Relief?" you get directed to

To qualify as R&D, any activity must meet the definitions set out by the Department of Trade and Industry (DTI) - this organisation is now known as the Department for Business, Innovation and Skills. These guidelines state that the activity must contribute directly to seeking the advance in science or technology or must be a qualifying indirect activity.

if you follow the first link you find its complicated.  Here are some quotes

To qualify as R&D, activities must fall to be accounted for as R&D under GAAP, and under whichever standard, as R&D (see BE Studios v Smith Williamson Ltd, HC04C0110).

Following the Guidelines, then, for there to be R&D, a company must be undertaking a project to seek an advance in science or technology through the resolution of scientific or technological uncertainties.

And
The advance being sought must constitute an advance in the overall knowledge or capability in a field of science or technology, not a company’s own state of knowledge or capability alone
And (my italics)
There may well be an important difference between a project for the development of a commercial product and an R&D project within the meaning of the legislation. A company with a project to produce a new product will often consider the whole project to be R&D. But this is not necessarily correct for the purposes of R&D tax relief. The activities that constitute R&D for tax purposes are those activities undertaken as part of the project which fall to be accounted for as R&D under generally accepted accounting practice and also fall within the special definitions set out in the BIS Guidelines (formerly DTI Guidelines) for activities to be treated as either ‘directly contributing’ to seeking the advance in science or technology, or as ‘qualifying indirect activity’.

Other aspects of the project will not be R&D for tax purposes, either because they are not seeking an advance in science or technology or because the activities fall outside the scope of R&D for tax purposes. For example, the BIS Guidelines (formerly DTI Guidelines) specifically exclude certain activities from the scope of R&D for tax purposes,

The fact that there is some advance in science or technology being sought within the project for the development of a new product does not make the whole of that project an R&D project for the purposes of the relief. So, for example, market research to identify the demand for the new product is not part of the R&D. A project for the development of a new product, that is not of itself R&D, may contain elements or sub- projects that can be R&D projects for the purposes of the relief. It is those elements or sub- projects undertaken with an aim to extend knowledge in a field of science or technology to which the relief applies. The sector in which activity is taking place does not change this

Finally we have a concrete example:
There is guidance on the meaning of R & D for tax purposes in BE Studios v Smith Williamson Ltd (the case number at the High Court is HC04C0110).
BE Studios had a project to produce new software. Mr. Justice Evans-Lombe accepted that it was not sufficient that the claimant’s products were innovative or cutting edge for them to be R&D within the meaning of the statute. The fundamental test was whether the software work sought to achieve a scientific and or technological advance, and formed the whole or part of a project to resolve scientific and or technological uncertainty on a systematic basis.
On the subject of computer games, he indicated that there were a number of stages in the production of a computer game. These involved conception or acquisition of the ideas for the game, planning, script-writing, drawing and designing backgrounds and characters, creating animated sequences and soundtrack and programming the result of these. He said ‘none of these activities without more necessarily involve qualifying R&D’.
He was presented with an extensive description of the company’s objectives in terms of new functionality and computer environments, but said that this nowhere described any new scientific or technological knowledge. The judge found that there was no evidence presented that supported the claim that R&D within the BIS Guidelines (formerly DTI Guidelines) had been carried out.
 

Thursday, 17 September 2015

Index numbers

I am today at the launch of the Global Innovation Index.  It takes a large range of countries, and a  massive range of indicators, from ICT intensity to FDI for each country.  It then weights these various measures within each country by 0.5 or by 1.  The combination of these measures adds up to an index, and it turns out that Switzerland is one and the UK is two.

If one is going to construct an index, one needs to understand a bit of index number theory and mechanics.  Thus turns out to be important, as we know from the ONS RPI and CPI.  We can learn from this and this link is useful, Differences between the RPI and CPI Measures of Inflation

"The basic approach to the measurement of inflation adopted by both the CPI and RPI is the same. Both track the changing cost of a fixed basket of goods and services over time and both are produced by combining together around 180,000 individual prices for over 650 representative items. Differences arise due to coverage, the population base of the indices and the way in which individual price quotes are combined at the first stage of aggregation."

let us focus on the way these are combined.

At the first stage of aggregation, the RPI is constructed using an arithmetic mean (AM).
There are two different methods, applied to different items but, for example, the AM would be calculated as follows;

if one price increased by 25% from the base period (which=100) and another decreased by 20% their new index values would be 125 and 80 respectively. The AM of these is;
125+80 =102.5, 2
indicating an ‘average’ price increase of 2.5%.

Now compare with the CPI

At the same level, the CPI uses a geometric mean (GM) which, taking the values used in the adjacent example is calculated thus,
125*80 = 10000 =100 , indicating that there has been
no change in prices.
An advantageous property of the geometric mean is that it can better reflect changes in consumer spending patterns relative to changes in the price of goods and services.

This formula effect means the CPI is higher relative to the RPI by about 0.8 percentage points for June 2010.

So it very much matters what weights are chosen.  One might experiment with the weights, which is what is done in the Report.  So that goes partway to checking how robust this all is, but one also needs to know how the index is constructed: why use arithmetic, which is what they do, and why chose 0.5 and 1?


Technical note. Why are these two indices in the example above different?  It is not really to do with the spending pattern weights, although that is an advantage of the geometric method.  Rather it is to do with transitivity of indices.  Consider a rise from 100 to 150 and back to 100.  On a percentage basis, inflation has risen by 150-100/100=50% in the first period and fallen by 150-100/150=33% in the second period.  But 50-33 is not equal to zero.  This is the problem with arithmetic means done this way which do not return to their base level, here 100, when adding percentage changes.

A further note on this.
Further note
The way to think of the geometric index is that it is an arithmetic average of the logs of the prices i.e. = ½*ln125+1/2*ln80 where “ln” is a natural log (so the index is calculated as the square root of the product of the two numbers).  One property of logs is that a log relation “flattens” as the number gets larger, so that a log change from 0-10 is much larger than a change from 1,000 to 1,010 even those the absolute change is 10 in both cases.  This “downweighting” of the larger numbers has a desirable economic property for it controls in part for substitution bias.  That is, as goods get more expensive, they are downweighted in the index, but that is correct since more expensive goods are presumably consumed less.  This intuition tells you that a better but more complicated index would weight log changes by their shares in total expenditure which is just what official price indices do: note that the billion dollar price index does not do this.


In case this is still seen as arcane, remember that UK pensions are now updated by the CPI and not the RPI.  That has lowered their updating and in fact counts for the bulk of austerity savings in the UK.   

Finally, back to the Innovation Index

This paper, http://arxiv.org/pdf/1104.3009v2.pdf contains a discussion of how adding and multiplying can give different results.  That's only part of the point.  The index adds up a measure of, for example, GDP growth, expenditure on schools and number of YouTube videos uploaded (see  Appendix III, esp page 403).  But without a clear view on the relative weights of these indicators it is hard to interpret the overall index.

Monday, 7 September 2015

Various teaching links: taxes on windows and the number of windows.

Do agents respond to incentives?   Yes they do: putting windows in their house for example.

 Oates, Wallace E., and Robert M. Schwab. 2015. "The Window Tax: A Case Study in Excess Burden." Journal of Economic Perspectives, 29(1): 163-80, show the following.

 They have tax records between 1747 and 1757 from the UK. As they say

We focus initially on the observations in our dataset from 1747 to 1757. As
we discussed above, the window tax was unchanged over this period and included
three notches. A homeowner in this period paid no tax if the house had fewer than
10 windows; a tax of 6 pence per window if the house had 10–14 windows; a tax
of 9 pence per window if the home had 15–19 windows; or a tax of 1 shilling per window if the home had 20 or more windows. Thus the marginal and average tax rate jumped sharply when a consumer installed the 10th, 15th, or 20th window.

 Do agents respond to incentives?  As they then say
If the window tax distorted behavior, then we should expect to see “too many”
homes with 9, 14, or 19 windows.
And this is just what they find on their sample of 496 homes during this period in Ludlow, a market town in Shropshire.


As they say
There are sharp spikes in the number of homes at all three
notches.12 At the first notch, 18.8 percent of the homes have 9 windows, while
4.2 percent have 8 windows and 4.2 percent have 10 windows; at the second notch,
17.7 percent have 14 windows, while 6.0 percent have 13 windows and 1.6 percent
have 15 windows; and at the third notch, 6.5 percent have 19 windows, while
3.4 percent have 18 windows and 1.0 percent have 20 windows.


Various FTMBA teaching links

1. Do agents respond to incentives?

a. How Converse sneakers reduce their tariffs#
b. Cesarian-section deliveries when rewards are higher


2. Supply and demand
Rare earth

3. Elasticities and revenues
The London congestion charge.

4. Two-sided markets.
What Spotify is doing.

5. Barriers to entry.  See table 1 for a very good summary of natural and strategic entry barriers in UK banking, especially around IT and capital regulation.


Wednesday, 24 June 2015

Is "capital efficiency declining?

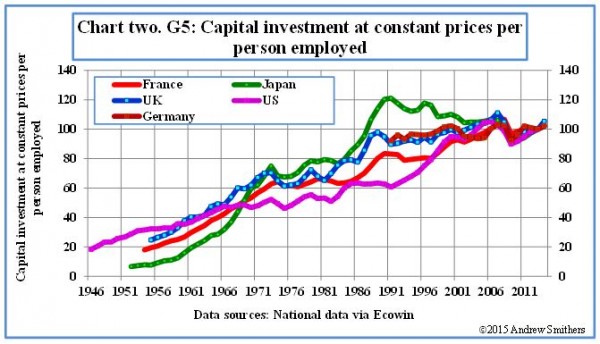
Andrew Smithers has a post today saying that capital efficiency is declining.  He observes steady growth in labour productivity, with a decline in recent years as follows.


He then compares that with investmetn per person employed and observes that is rising, suggesting that investment must be less "efficient". 


to a work-a-day productivity economist like me, this is all a bit confusing and I'm not sure I agree with his conclusion.  Here's why.

Productivity economists say that output per person depends on capital services per person and the efficiency with which that capital is used (there's also human capital, but lets just focus on non-human capital for the moment).  So Ryanair produce a service of getting from A to B.  They use planes, computers and check-in desks to do this, all of which provide capital services.  They also try to use these very efficiently, with ticketless boarding, fast turnarounds etc.


The capital services in an economy is related to, but not the  same as, investment.  When Ryanair invest, some of their investment replaces worn out stuff.  And if we want to calculate capital services, we cannot just add up investment in planes, computer and desks, since that's adding apples and oranges. We have to weight the capital by its flow of services that it provides: 10 computers and 10 desks don't yield the same capital services. 

We also know that as economies develop they buy more and more machines so workers can work with more/better capital services (compare your computer now with that 15 years ago).

So what would you expect to see?  First, capital services per employee would rise.  Second,
you would expect a close relation between growth in value added per person employed and growth in capital services per person employed, with an additional kick from growth in efficiency.

To look at this, see below, I used the published Bank of England historial database which has the volume of value added (V, real GDP worksheet, column R) and employment and capital services (N and K, worksheet supply side data column B and E).  The growth rates are indeed close, with the exception of the last year (2009).  So that is just what we  would expect it seems to me, and I'm not sure I see and decline in "capital efficiency", unless capital efficiency is defined in a way I don't understand.


Thursday, 11 June 2015

The Too Big To Fail Subsidy in UK Banking: a concrete example

From the CMA inquiry into retail and SME banking, here is a case study from a new entrant, Metro Bank:


Capital requirements
37.
Metro stated that it was currently required to hold around six to ten times more
capital than the big banks and building societies when securing a mortgage
for a customer, even if it was for the same customer, with the same deposit,
on the same property – a situation which did not reflect a level playing field.
 
38.
To elaborate this point, Metro told us that as a new entrant to the market, it
had to use the standardised approach (SA) to credit risk when calculating
capital requirements, while the larger banks were permitted to use an internal
ratings based approach (IRB). Metro indicated that the IRB approach was
based on many years of data, and enabled certain institutions to significantly
reduce the value of their risk-weighted assets.

Note that  the IRB is a calculation done by the banks themselves.  

40.
Metro pointed out to the CMA the difference between the SA and IRB by
using an example of
a low loan- to -value residential mortgage.Metro stated
that such a mortgage carried the same risk profile regardless of the lending
institution but the challenger banks risk weight these particular assets at 35%
compared with 3 to 6% for the larger banks.

And here's the answer from the regulators

42.
In March 2013, the FSA and the BoE announced a shift in approach to the
prudential regulation of banking start-ups whereby the additional requirements
(known as ‘add-ons and scalars’) previously applied to reflect the
uncertainties inherent in start-ups were no longer to be applied. These
requirements according to the two regulators often resulted in capital and
liquidity requirements for start-ups being higher than for existing banks.

43.
In a follow-up review, the PRA and FCA referred to the IRB approach to
calculating credit risk versus the SA (the default position) for all new and
existing banks and noted that ‘The PRA has taken steps to address
underestimation of risks that can result from applying the IRB approach to
certain types of exposures.’ According to this review, the PRA was to
continue to consider the impact of its policies on competition as required by its
competitive objective with a caveat that the regulatory capital requirements
were to a large extent determined by the relevant EU legislation over which
PRA had little or no discretion

Wednesday, 20 May 2015

How UK employment changes just deepen the UK productivity puzzle

John Kay in today's FT on the employment growth at the same time as falling productivity kindly refers to our paper on this

"What have these additional workers been doing? Professor Jonathan Haskel and his colleagues at Imperial College London argue that they have not been employed in low-productivity industries, nor have they been particularly low skilled. Yet the BoE’s analysis is that — especially in the past three years — an increasing proportion of employment growth has been in low-skilled jobs.
In case people think there is a contradiction, the bottom line is that there is not.  First, the  data in our paper goes to 2011, and the effect the Bank talk about is only in the last few years.  Second,it is possible that high skilled individuals are in low skilled jobs, but even if they were, it is only a recent effect and would still leave much of the puzzle unexplained.

Here are some more details. 

The May 2015 Bank of England Inflation report, Chapter 3, has this graph.


If you look closely at it you see that from 2010 to end 2013, the blue lines are the highest, that is, employment growth was predominantly in high-skilled occupations.  It is true that since then there has been more growth in the low skilled, but that is only recent.  If you download the data underlying the chart which the Bank helpfully provides, you see the following: employment growth since 2010Q1 to 2014Q1 in high skilled = 1m, medium skilled = 0.5m, low skilled = 0.3m.  That is, employment growth over the whole period is in the high skilled groups. But John and the Bank are quite right to point out that in the most recent year there is faster growth in the low skilled.

Our paper that John kindly refers to looks at the productivity consequences of this (here, summarised on page 1, more detail in sections 5 and 6) .  There are a number of points.

First, our data only goes to 2011, and we also have much more growth in the high skilled, agreeing then with the Bank.

Second,  the effect on productivity can occur, as John points out, in two ways. 

  1. productivity can change in all industries as the "mix" of worker types employed changes.  Since the mix of types has changed to be high skilled, then this would tend to raise productivity, deepening the puzzle
  2. productivity can change if workers move from industries that are high productivity on average to those that are low productivity on average.  We find this is not the case, in fact, since 2008 it has been the opposite, namely workers moving to high productivity industries.  This again deepens the puzzle.
 
Is it possible that these high skilled workers are in low skilled jobs?   It is quite possible, but if that is the case, then we would expect them to be paid less than if they were in high skilled jobs. We weight the various types of labour by their wage, so if this effect were occuring then we  would expect changes in the weights would account for it.  We have no data on this in recent years, but don't see an effect in the period up to 2011.  So we don't think that labour composition, at least at this level of aggregation, will explain the puzzle.