Wednesday, 29 January 2025

Building new infrastructure: getting a sense of scale

 The Chancellor is going it seems to announce backing for new infrastructure today.  For example, a new runway at Heathrow might cost £14bn (see Tim Leunig's excellent substack: https://timleunig.substack.com/p/how-to-fund-heathrows-expansion) .  Is that a lot or a little?

1. the official ONS capital stock data are hereDataset Capital stocks and fixed capital consumption  and the publication using the data is here: Capital stocks and fixed capital consumption, UK:


2. Here are the data for 2023


Note to table: Some definitions are: “Other buildings consist of all buildings that are not dwellings and include commercial buildings, industrial buildings, and buildings used to provide public services (for example, schools and hospitals). Other structures include those that are not buildings; for example, transport (roads, railways, runways, ports), energy and communications infrastructure.” (https://www.ons.gov.uk/economy/nationalaccounts/uksectoraccounts/articles/improvingestimatesoflandunderlyingotherbuildingsandstructuresinthenationalbalancesheetuk/2022). 

3. As the table shows

    a. around 75% of the captial stock are buildings of various types.  

b. the total value of the UK capital is 10,751 billion.  If a third runway, which is a huge project, costs £14bn, that's an increase of 0.13% of our nation's capital stock.  

Tuesday, 14 January 2025

The Creative Industries

 I often struggle to remember who is in and out of the official definition of the creative industries. Here is the table:


And the source of all this is here: taken from the DCMS Sectors Economic Estimates Methodology


Thursday, 9 January 2025

India's growth success: log scales in action

 In class we have spent a lot of time saying how informative log scales are. Here's a perfect illustration from Martin Wolf in the FT. 

1. The main story is : An economically dynamic India is Manmohan Singh’s greatest legacy. He drove radical reform of an anti-market policy regime that was strangling growth. Link

2. "Singh’s most important achievements as a policymaker were made during his years as finance minister from 1991 to 1996. "

2. How do we see that in the data?  Notice the log scale allows us to read off the growth rate break from just that time.


4. and here by contrast is the data on a non-log scale: which fools you into thinking it's a post-2000 effect.


Addition: applying the rule of 72 to the growth rates in the FT graph, we have that before Singh it takes 72/1.6=45 years to double GDP per head, after 72/5.2=14 years. 

Saturday, 4 January 2025

Visual summary of our work on intangibles

If you'd like a beautiful visual summary of some of our work on intangibles, do look at this amazing graphic storyboard from The Beautiful Truth

The magazine is at this link. The graphics are fantastic.


Tuesday, 17 December 2024

Public and private sector pay

 As ever the IFS is brilliant on this, from a July 2024 paper, by Cribb and O'Brien

1. The overall picture is lagging public sector pay since 2001.


"And taking the long view, real public sector pay at the end of 2023 was still 1% lower than its level at the beginning of 2007, almost 17 years earlier. Real private sector pay was only 4% higher over the same period."

2. Interestingly, public pay has varied an awful lot, with low paid public sector workers doing relatively well.  


3. and different professions faring differently. 


IFS say

"Figure 6 shows how pay has changed for some major (and high-profile) public sector occupations: nurses, doctors, teachers and educational assistants compared with the public and private sectors as a whole.5 For comparability (particularly due to discontinuities in NHS England data), we focus on the period since 2010. 


Figure 6 shows that pay for most of these high-profile public sector occupations has fallen by more since 2010 than the average for public sector wages. The one exception is educational assistants, a relatively lower-paid occupation, whose average pay grew significantly faster than even average pay in the private sector. That pay growth for teachers, doctors and nurses lagged behind the public sector average is not necessarily surprising due to the pay compression in the public sector documented in the previous section, as these are among the better-paid public sector occupations. The reductions in pay for teachers in the 2010s were particularly large and slightly larger than implied by pay scales, reflecting the fact that the teacher workforce has become slightly less experienced (and therefore less well paid) over time.6 This has happened in other occupations too; for example, there have been significant expansions in the number of doctors over time, leading to increases in the share of doctors who are younger and therefore less well paid (General Medical Council, 2023). 


The labour market: December 2024 release

1.  I have been worried for some time that the UK labour market has been impaired following the disruption from Covid and the like.  To me, there is a risk that U* has risen to more than 4.5% the BoE has estimated (their estimate is on p. 13 of the November MPR).

2. So the labour market data will be crucial on this.  What does it say? Fkigure 4 of the release shows a blip up 

"Annual average regular earnings growth for the private sector was 5.4% in August to October 2024 (Figure 4). This was up on the previous three-month period (4.9%) and last higher in March to May 2024, when it was 5.6%."


3. What are we to make of this blip up?  I don't want to read too much into one month, but it's concerning.  The ONS does say "This growth rate is affected by a small decrease in the October 2023 estimates, which has caused a slight base effect.".  It turns out that wages fell in October 23, so there is an effect here, but this is one month in a 3month on 3 month measure.

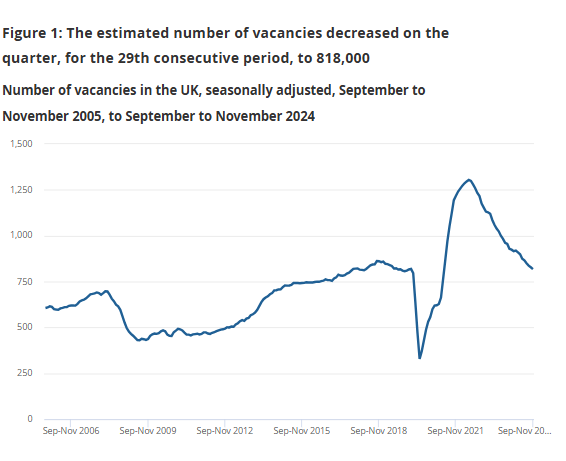
4. Vacancies have continued to fall, and are now roughly at the 2019Q4 pre-pandemic level.  Our previous work, however, showed this was inflationary.


5. this gives a VU curve like this


which uses overlapping months.  


Wednesday, 13 November 2024

Adjustments along many margins

We have spent time in class reviewing how firms can adjust to prices by changing no only quantities, but other margins as well.  Here's an example from the Next case 

Para 396: "in the early 2000s paid rest breaks which sales consultants had received were removed following the introduction of the national minimum wage".

Thursday, 17 October 2024

Natural experiments and internal/external validity

Scanning an old piece by the ever-brilliant Ed Leamer.  He says "Our understanding of causal effects in macroeconomics is virtually nil, and will remain so."

I have a lot of sympathy with this after my time on the MPC.  It's worth remembering that the model is as he sets out


where 

1. x is the treatment 

2. y is the response

3. z are interactive confounders

4. w are additional confounders.


The treatment effect in macro we would like to estimate is . 


As he says

"The big problem with randomized experiments is not additive confounders; he big problem with randomized experiments is not additive confounders; it’s the interactive confounders. This is the heterogeneity issue that especially t’s the interactive confounders. This is the heterogeneity issue that especially concerns Heckman (1992) and Deaton (2008) who emphasized the need to study oncerns Heckman (1992) and Deaton (2008) who emphasized the need to study “causal mechanisms,” which I am summarizing in terms of the interactive causal mechanisms,” which I am summarizing in terms of the interactive z variables" 


"With interactive confounders explicitly included, the overall treatment effect ith interactive confounders explicitly included, the overall treatment effect β0 + β′ zt is not a number but a variable that depends on the confounding effects. s not a number but a variable that depends on the confounding effects. Absent observation of the interactive compounding effects bsent observation of the interactive compounding effects z, what is estimated is what is estimated is some kind of average treatment effect which is called by Imbens and Angrist (1994) ome kind of average treatment effect which is called by Imbens and Angrist (1994) a “Local Average Treatment Effect,”" 

"absent observation of z, the estimated treatment effect should be transferred only into those settings in which the confounding into those settings in which the confounding interactive variables have values close to the mean values in the experiment." 

"This is the error made by the bond rating agencies in the recent fi nancial nancial crash—they transferred fi rash—they transferred fi ndings from one historical experience to a domain in ndings from one historical experience to a domain in which they no longer applied because, I will suggest, social confounders were not hich they no longer applied"


Tuesday, 8 October 2024

Does the EU or the US have an investment problem?

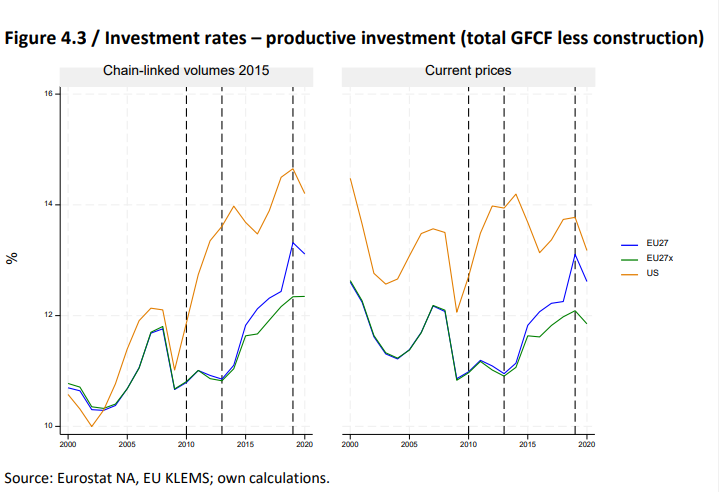
 The recent Draghi report says it's an EU problem : here's their Figure 5


but notice it says "productive investment".  What is this? A footnote takes us to Hanzl-Weiss, D., & Stehrer, R., ‘Dynamics of productive investmentand gaps between the United States and EU countries’, European Investment Bank Economics Working Paper, 2024/01, 2024. 

Figure 3.1 of this shows the oppostite of the above, 


namely the US always behind.  So what's going on?  If you exclude dwellings and other buildings and structures, you get closer to the picture above

here's just excluding dwellings


and here's excluding dwellings and other structures


Hence the focus on "productive" investment.  Back to Draghi "This innovation gap also translates into a gap in overall productive investment between the two economies, which is driven mainly by lower investment in tangible ICT assets and in software, databases and intellectual property".


Thursday, 19 September 2024

How much extra output do we get if we invest more?

 This expands on today's earlier post.

How much extra output do we get if we invest more?

How much extra output do we get if we invest more? Here’s some rules of thumb.

1.       From the RF growth mindset report, some useful data as background.

2.       Here’s our underperformance relative to the G7


3.       And here it is in bars:


4.       So we might regard our target is

a.       To get the US GDP per capita growth rates, we need another 1.55-1.03 = approx 0.5% growth per year.

b.       Notice that’s relative to the USA, relative to EU would be much less than that.

5.       How can we get to this via capital investment?  Here’s the tyranny of numbers.

6.       The extra output from 1 extra unit of capital sounds like an engineering problem.  But we can use some economic reasoning to get some measures.

7.       The average rate of return on capital is about 0.10 as measured by the ONS.  That says that the flow of profits from the existing capital stock in the UK, as a percentage of that capital stock, is just below 10%. 

8.       Let’s take a concrete example to check this.  In Feb2024, according to IBA Aero, the price of a new A320neo was $52m.  The monthly rental cost was $400,000.  This ratio is 9%.  So that says that airlines are incurring a cost of renting a new aircraft that is 9% of the capital stock they would have to buy.

9.       If we further assuming that airlines are maximising profits, then they would rent more and more aircraft until the extra flow of output they can sell from renting another aircraft were equal to the extra costs.  But we have just worked out the extra costs are 8%. 

10.   That gives us part of the answer: for every increase in capital stock by one unit, output rises by 0.08 units (0.1 units for the economy as a whole)

11.   It’s more helpful to convert that into a percentage.  We can do this if we express the change in output following a change in capital, the 0.1, as a proportion of the baseline output/capital ratio.  That ratio, for most developed economies, is around 3.

12.   Thus we have the following:

a.       Average rates of return are around 0.1.  This tells us the extra output from one more unit of capital.

b.       Average output/capital is 3. 

c.       So the percentage extra output from a one percentage extra capital is 0.1/3 = approx. 0.3.

13.   What percentage rise in output do we get from a percentage rise in capital then?  For the economy as a whole the rule is


% rise in output from x% rise in capital asset A= 0.3 * share of capital asset A in the economy * % change in capital asset A.

14.   Let’s apply this rule to housing.  It is planned to raise housing input by 0.3%.  Housing is 40% of the total capital stock.  Thus the expected % rise is 0.3*0.4*0.3% =0.036%.