Saturday, 29 September 2012

How to reduce public debt: lessons from history

How have countries in the past reduced their public debt?  By inflation? By spending cuts?  Most people would probably say inflation.  So what do we know?

Paul Krugman points us to Chapter 3 of the IMF World Economic Outlook entitled The Good, the Bad, and the Ugly: 100 Years of Dealing with Public Debt Overhangs".  It's really good.  Here's my take on it.

1. Public debt has reached very high levels


 2.  So what's to worry about?  The worry is getting on an unsustainable path so that the stock of debt relative to GDP rises too fast.  here's the formula that tells you how it evolves and so how to get it down:


where
b=Debt/GDP ratio
i = interest on the debt
pi== inflation
g = real GDP growth rate
d= primary deficit-to-GDP ratio.
and e an error due to accounting adjustments and the like (ignore this).

What do we learn from this?  I find it more instructive to write this as the change in b so we can see directly how the change in debt/GDP evolves.  this gives

change in b= (i--g)/(!+i-+g)b(t-1)+ d+ e  (ignoring some terms in g).  The bottom line of this is very close to 1, so let us write it as


So what?  Have a look at the co-efficient on b(t-1), the first bracket.

a. As a matter of maths, if the bracket very large then the change in b depends very much on last year's b. That's bad: it says, the more debt you had last year, the bigger the increase this year.  This comes from the effects of interest that accumulates the debt burden and growth that relieves the debt/GDP ratio.

b. If in fact the top line is zero, that would be good.  Last years' debt would have no impact on debt growth.  So the only thing that drives Db would be the deficit, if one controlled that all would be well.

c. As a matter of data it turns out that over most periods, guess what, the top line is zero.   That is to say, the real interest rate typically is about the growth rate.  Indeed, in good times, the real interest rate is below the growth rate, and so the debt burden can be cut just thru growth.

d. all this shows cutting the debt burden can happen in a number of ways
  • low real interest rates. in turn that means
    • low nominal interest rates and/or
    • high inflation.  So you can see the scope for surprise inflation getting rid of the debt.
  • high growth
  • low primary deficit
So how in history did economies get out of their debt problems? The IMF pick a number of countries and periods and show this:


The top left is the UK between the wars.  They pursued a very tight money policy with high interest rates, lowed spending all in order to try to deflate their way back to the gold standard.  As the low blue panel shows, cutting spending did some of the work.  But tight money raised the interest rate, and low inflation meant high real interest rates, and all that worked against the reduction programme.  As did very slow growth.

Other countries have been trying different ways. The US in the 40s+ did it by inflation and some growth.  The Japanese are not cutting spending etc.

What do the IMF conclude?
For countries currently struggling with high public
debt burdens, the historical record offers both instructive
lessons and cautionary tales.

The first lesson is
that fiscal consolidation efforts need to be complemented
by measures that support growth: structural issues need to be addressed and monetary conditions
need to be as supportive as possible. In Japan,
for example, weaknesses in the banking system and
corporate sector limited monetary policy efficacy and
led to weak growth, which prevented fiscal consolidation.
As a result, debt continued climbing until these
issues were addressed. In Italy, Belgium, and Canada,
debt did not fall until monetary conditions were supportive.
Here, reforms to wage-setting mechanisms
that broke the wage-price spiral were an important
contributor to the establishment of the supportive
monetary environment. Furthermore, monetary easing
also fostered exchange rate depreciation, which
supported external demand and growth.

The case of the United Kingdom reinforces this
message but also offers a cautionary lesson for countries
attempting internal devaluation. The combination
of tight monetary and tight fiscal policy, aimed
at significantly reducing the price level and returning
to the prewar parity, had disastrous outcomes.
Unemployment was high, growth was low, and—
most relevant—debt continued to grow. Although
the price level reduction the United Kingdom was
attempting to achieve is larger than anything likely
to happen as a result of internal devaluation today,
similar dynamics are evident. A reduction in the
price level, a necessary part of internal devaluation,
comes at a high cost, and determining whether the
cost outweighs the benefit to competitiveness from
internal devaluation requires further work.

The case of the United States, although supporting
the general finding about the contribution of
monetary policy, points to more outside-the-box
possibilities. U.S. monetary policy was very supportive
in the immediate postwar years as a result of limits
on nominal interest rates and bursts of inflation.
This particular combination quickly reduced the
debt ratio while growth remained robust.

A second lesson is that consolidation plans
should emphasize persistent, structural reforms over
temporary or short-lived measures. Belgium and
Canada were ultimately much more successful than
Italy in reducing debt, and a key difference between
these cases is the relative weight placed on structural
improvements versus temporary efforts. Moreover,
both Belgium and Canada put in place fiscal frameworks
in the 1990s that preserved the improvement
in the fiscal balance and mitigated consolidation
fatigue.

A third lesson is that fiscal repair and debt reduction
take time—with the exception of postwar
episodes, primary deficits have not been quickly
reversed. A corollary is that this increases the vulnerability
to significant setbacks when shocks hit. The
sharp increases in public debt since the Great Recession—
including in the relatively successful cases of
Belgium and Canada—exemplify such vulnerability.
Furthermore, the external environment has been an
important contributor to outcomes in the past. The
implications for today are sobering—widespread
fiscal consolidation efforts, deleveraging pressures
from the private sector, adverse demographic trends,
and the aftermath of the financial crisis are unlikely
to provide the supportive external environment that
played an important role in a number of previous
episodes of debt reduction. Expectations about what
can be achieved need to be set realistically.

And the IMF make threee suggestions
Based on these lessons, we suggest a road map for
successful resolution of the current public debt overhangs
 First, support for growth is essential to cope
with the contractionary effects of fiscal consolidation.
Policies must emphasize the resolution of underlying
structural problems within the economy, and monetary
policy must be as supportive as possible.

Second, because debt reduction takes time, fiscal consolidation should focus on enduring structural change.

Third, while realism is needed when it comes to expectations about future debt trajectories and setting debt targets in a relatively weaker global growth environment, the case of Italy in the 1990s
suggests that debt reduction is still possible even without
strong growth.
All this goes to show how deeply endogenous all these relationships are.  To those calling for fiscal expansion, the reply is often "what will the markets think" i.e. that a rise in d might cause a rise in i which compounds the problem. Somehow if we are to have a Keynesian expansion we have to find a way to do it without raising interest rates: some new mechanism by which investor will trust future governments who promise to spend now that they will cut in the future.  As ususal then, the answer to our problems is innovation: we need some institutional mechanism that ensures spending either really will be cut later, or that spending does really enhance growth.

So the most obvious one would be to try for the latter. We have to have a policy that will help us have some growth: the lesson for the UK in the 1930s, as Krugman observes, was that the austerity was undone by slow growth.  That says to me that any increased spending should proritise the science budget and the internet (good for growth) and building housing (likewise).

Update.
 The always excellent Tim Taylor, Conversable Economist, blogs on this too. 
and the Maths of all this are well set out in Ley, 2010, Fiscal and external sustainability.

Wednesday, 26 September 2012

Infrastructure

A twitter exchange:

1.Depressing news from Spain. Will more infrastructure help? The case of Valencia 7 s

2. Andrew Sissons points me to thsi: roads tend to have a much better BCR than rail. (e.g. see bottom of p.37 here: )

3. on p.38, I find
It is estimated that 89% of current congestion is on urban roads18, and it tends to be worst in the inner and central areas of the largest conurbations, particularly London. However, these are the locations where a combination of mode shift to public transport, traffic management and pricing
have the most to offer, as the densities of destinations favour high capacity services. They are also locations where road building is most difficult and expensive. In London, the scale of the
demand and the density of the destinations justify expansion of existing public transport capacity and major projects such as capacity enhancements to the national rail network, Crossrail and new Underground lines.

4. Russ Roberts and Bob Frank debate infrastructure on Econtalk. 

The argument seems to me to be:

a. Valencia shows that trophy projects e.g. opera houses yield low return and
b. The US, according to Russ has a  political process is biased towards such projects, or more accurately, he asks why all this seemingly essential infrastruture has not been spent on.
c. My personal view is that this is why the UK MP expenses scandal is so very toxic: it has poisoned the notion that UK governments can make good decisions.  


Tuesday, 25 September 2012

Fiscal policy in the United States of Europe

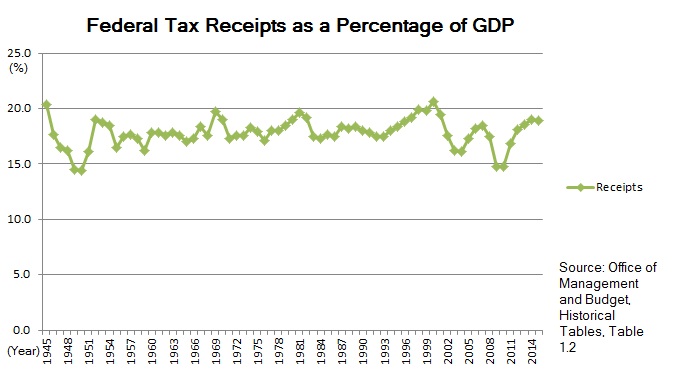
Here's the US Federal Tax receipts as a proportion of GDP


http://upload.wikimedia.org/wikipedia/commons/7/75/U.S._Federal_Tax_Receipts_as_a_Percentage_of_GDP_1945%E2%80%932015.jpg


and  the excellent Karl Whelan points us to something really important
Another Step Toward A Federal Europe? Talks To Expand EU Budget ould Be Watershed Moment.   
He notes that the current EU figure for Brussels is around 1%, of which 0.5% is on farming.  My take, for what it's worth, is that the farming figure unfortunately is a signal of what most people would expect a higher Brussels tax take to be spent on. I do hope I am wrong.

Saturday, 15 September 2012

Quis custodiet ipsos custodes?

The answer for the 21st Century (HT Tyler Cowan).

I was reminded of the quote listening to Great Lives on Radio 4 the other day, on Juvenal.  As ever on Radio 4, fascinating.  For all the things I love about America, and there are very many, living in the US for 8 months makes you appreciate the BBC.


Thursday, 13 September 2012

The UK's recession: long and large, or short and shallow?

Chris Giles publishes a post today commenting on the NIESR graph of the UK's recession, which has become rather well-known.  The reason is that it shows the current recession as being long and large in relation to others:

http://blogs.r.ftdata.co.uk/money-supply/files/2012/09/7-September-2012-niesr-chart.jpg

Source:  NIESR, via FT.

Chris then cautions us that this is an graph of one measure of recession, namely real output.  What about employment?  Here we have it


Source: FT 

And it shows the opposite, namely the recession is short and shallow.

Let me put my productivity hat on and add a third dimension.  As Krugman is fond of saying, productivity isn't everything, but in the long run its almost everything, since it determines long run living standards. The excellent Joe Grice, Chief Economist from the ONS gives us the equivalent graph for output per hour: here it is:


Source: chart 2 in  Grice, J (2012) ‘The Productivity Conundrum, Interpreting the Recent Behaviour of the Economy’, ONS website.  

Of course, this combines the information in the other two graphs, but I would argue is a third interesting piece.  As the top line shows, the productivity recovery from the 1990 recession was fast, that recession being comparatively mild.  The recovery from the 1980 recession, next line down, was the start of the Thatcher productivity miracle and so was very quick.  The recovery from the 1973 shock makes salutary reading: that signalled a worldwide productivity slowdown, that continued until the ICT boom in the 1990s.  The current recovery looks scarily like that, though we don't at present have much idea on whether there is some underlying technological slowdown explaining it.

Thursday, 19 July 2012

The UK innovation index

is just published, using our results!  here's the link to a nice executive summary plus our research paper
http://www.nesta.org.uk/publications/assets/features/innovation_index_2012

Tuesday, 26 June 2012

US petrol

Living here in the US, I find people complaining about the cost of gasoline (currently about $3.40 per US gallon).  How does that compare?  In the UK, costs are about 1.35 UK pounds per litre.  A litre is 0.26 of a US gallon and the exchange rate is about 1.54.  This is about $8 per US gallon.  The BBC helpfully shows that about 60% of the UK costs are tax and duty


Monday, 25 June 2012

Has the Bank of England missed its inflation target?

Martin Weale writes
Over the period since I joined the MPC, the average inflation rate has been just under 4% per annum.
The target is 2%.

What can one say?
1. Martin also sets out the following graph:


As it says, there are numerous exceptional factors here, leaving him to point out:
Had fuel prices risen in line with the rest of the CPI and had VAT not gone up, then the average increase in the CPI index since I joined the MPC would have been, at an annual rate, 2.9% rather than just below 4%, still above target but less of an embarrassment.
Very nicely , he also points out 
But, while I am comfortable leaving out the effects of VAT, it can reasonably be asked whether picking and choosing beyond this gets us very far. The target we have been set is the Consumer Price Index, not the Consumer Price Index excluding this or that. ...had the MPC been able to persuade the public that they should focus their consumption on audio-visual, photographic and data processing equipment the price index would have fallen by 9 per cent at an annual rate. At least this would be true provided that people sat in the cold and did not watch television. The price of electricity has, after all, risen along with that of other domestic fuels
2. what are the Bank's objectives in fact?
When there is an adverse demand shock then inflation and growth go down together.  but with a cost shock, then high inflation comes with slow growth, so there is a trade-off.  What to do?  A statutory institution should look to what Parliament sets it to do.  The Chancellor writes to the Bank every year to set out the objectives.  Here is the 2011 letter: 


"The framework takes into account that any economy at some point can suffer from external events beyond its control....Attempts to keep inflation at the inflation target in these circumstances may cause undesirability in output" 


Monday, 11 June 2012

Globalization and U.S. Wages

Our latest paper in the Journal of Economic Perspectives. 


Globalization and U.S. Wages: Modifying Classic Theory to Explain Recent Facts

Jonathan Haskel, Robert Z. Lawrence, Edward E. Leamer and Matthew J. Slaughter
Article Citation
Haskel, Jonathan, Robert Z. Lawrence, Edward E. Leamer, and Matthew J. Slaughter. 2012. "Globalization and U.S. Wages: Modifying Classic Theory to Explain Recent Facts." Journal of Economic Perspectives, 26(2): 119–40.
DOI:10.1257/jep.26.2.119
Abstract
This paper seeks to review how globalization might explain the recent trends in real and relative wages in the United States. We begin with an overview of what is new during the last 10-15 years in globalization, productivity, and patterns of U.S. earnings. To preview our results, we then work through four main findings: First, there is only mixed evidence that trade in goods, intermediates, and services has been raising inequality between more- and less-skilled workers. Second, it is more possible, although far from proven, that globalization has been boosting the real and relative earnings of superstars. The usual trade-in-goods mechanisms probably have not done this. But other globalization channels—such as the combination of greater tradability of services and larger market sizes abroad—may be playing an important role. Third, seeing this possible role requires expanding standard Heckscher-Ohlin trade models, partly by adding insights of more recent research with heterogeneous firms and workers. Finally, our expanded trade framework offers new insights on the sobering fact of pervasive real-income declines for the large majority of Americans in the past decade.


Friday, 8 June 2012

How I helped add £3bn to UK GDP this morning

With apologies for shameless self-promotion...

Our Imperial team, working with ONS and the IPO, this morning raised GDP by £3bn.  Have we discovered the elixir of growth? No. We have, I think, discovered a new and improved method of counting investment in "artistic originals", that is the investment that firms make in books, music, TV programs and films (plus other artistic items like dance).  This investment is hard to measure and is typically done by counting spending by companies: coming, in 2009, to around £2bn according to the official data.  But the spending is, for various reasons, typically undercounted; spending on TV and films for example just considered a subset of companies. Our method tries to improve on that and estimates that a better estimate is around £5bn.  If that is all incorporated into the National Accounts, GDP will rise by £3bn.  That's not settled yet but expect at least some of it to be incorporated in the near future.

This is all part of trying to better understand the knowledge/creative/intangible economy and innovation in general.  Great that the IPO and ONS are supporting this line of work.

Update
Ken Jarboe (@intangibleEcon) points me to Jeff Wild at IAM Magazine -- who  posts "Copyright adds £3 billion to the UK's annual accounts.Is that all?"  Mr Wild wonders why the figure is so low, against UK GDP of around 1 trillion.  He compares this to an report for the US IPO, giving a figure of IP intensive industries accouting for $5.06T in GFP, 35% of US GDP.  That latter figure takes all industires whom they clasify as using IP intensively, around 75 out of 313 and adds their value added.  Our figure just takes the investment, that is long-lived spending, on creating artisitic originals by some UK industries.  The UK report on the "creative industries" follows something closer to the US method, but gets some very variable results.