Wednesday, 29 January 2025

UK Intangible investment: ONS data

 1. The ONS has estimates of UK intangible investment 97-02 : Investment in intangible assets in the UK: 2022 with data here: 

Investment in intangible assets in the UK


2. if we start by industry we have: 


Showing that these data are for what I call for short-hand the "business" sector, i.e. excluding L, real estate and O/P/Q, public admin, defence, health, educatoin.  

3. to get a sense of scale, what is GVA for these sectors? the ONS Blue Book, 2024, industry analysis, has this graph


with the underlying data here.  This gives totdal GVA= 2.265
tr, Govt = 0.433tr, Real estate = 0.292tr => business sector = 1.539tr  = 68% of total GVA (govt = 20%, real estate 13%).  

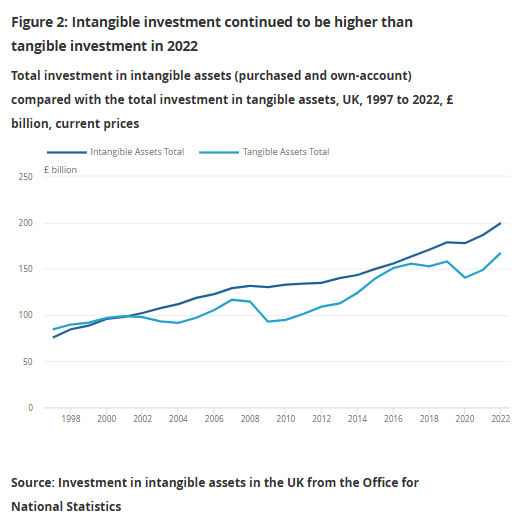
4. Returning to intangibles we have in 2022: tangible investment  = 167.3£m, intangible 199.7bn, of which £77bn is capitalised and £122 is not.  That gives 5% capitalised intangible/GVA and 12% total/(GVA+uncapitalised). 

5. the industry intangible intensities are below.  ICT, Manufacturing, finance and the arts are intangible intensive.


6. Finally, in comparing with tangibles we have intangibles higher than tangibles


with the 2022 figures being 199/(1539+122) = 12% and 167/(1539 +122)=9%.  (or for capitalised, 77/1539 = 5% and 167/1539 =  11%). 

Building new infrastructure: getting a sense of scale

 The Chancellor is going it seems to announce backing for new infrastructure today.  For example, a new runway at Heathrow might cost £14bn (see Tim Leunig's excellent substack: https://timleunig.substack.com/p/how-to-fund-heathrows-expansion) .  Is that a lot or a little?

1. the official ONS capital stock data are hereDataset Capital stocks and fixed capital consumption  and the publication using the data is here: Capital stocks and fixed capital consumption, UK:


2. Here are the data for 2023


Note to table: Some definitions are: “Other buildings consist of all buildings that are not dwellings and include commercial buildings, industrial buildings, and buildings used to provide public services (for example, schools and hospitals). Other structures include those that are not buildings; for example, transport (roads, railways, runways, ports), energy and communications infrastructure.” (https://www.ons.gov.uk/economy/nationalaccounts/uksectoraccounts/articles/improvingestimatesoflandunderlyingotherbuildingsandstructuresinthenationalbalancesheetuk/2022). 

3. As the table shows

    a. around 75% of the captial stock are buildings of various types.  

b. the total value of the UK capital is 10,751 billion.  If a third runway, which is a huge project, costs £14bn, that's an increase of 0.13% of our nation's capital stock.  

Tuesday, 14 January 2025

The Creative Industries

 I often struggle to remember who is in and out of the official definition of the creative industries. Here is the table:


And the source of all this is here: taken from the DCMS Sectors Economic Estimates Methodology


Thursday, 9 January 2025

India's growth success: log scales in action

 In class we have spent a lot of time saying how informative log scales are. Here's a perfect illustration from Martin Wolf in the FT. 

1. The main story is : An economically dynamic India is Manmohan Singh’s greatest legacy. He drove radical reform of an anti-market policy regime that was strangling growth. Link

2. "Singh’s most important achievements as a policymaker were made during his years as finance minister from 1991 to 1996. "

2. How do we see that in the data?  Notice the log scale allows us to read off the growth rate break from just that time.


4. and here by contrast is the data on a non-log scale: which fools you into thinking it's a post-2000 effect.


Saturday, 4 January 2025

Visual summary of our work on intangibles

If you'd like a beautiful visual summary of some of our work on intangibles, do look at this amazing graphic storyboard from The Beautiful Truth

The magazine is at this link. The graphics are fantastic.