Wednesday, 30 April 2025

US and UK TFP since the pandemic

 The BLS has just published an update on US labour and TFP growth.  Heres a graph of  private non-farm business. Red is TFP growth, dark blue is the contribution of capital intensity, light blue is contribution of labour composition.  Note the tremendous growth in TFP, red in the last two years.  


Lets zoom into the years since 2019: 


To get the same as possible data for the UK, I used data on UK market sector value added per hour, and market sector volume of capital services.  There is no recent labour composition that i could find. The UK labour share is about 0.59.  The UK picture since 2019 is below:


What do we see?

1. in the depths of the pandemic, 2020, both countries had high labour productivity (LP) growth, but with negative TFP in the US.

2. even in 2022, both countries had negative LP and TFP growth 

3. but it is amazing that US TFP growth in 2023 and 2024 has surged.  UK TFP and LP growth is tiny or negative over those years. 


Tuesday, 29 April 2025

Tariffs and the UK economy

 1. There are lots of conflicting effects of tariffs on UK inflation and activity.  They are set out by Megan Greene in a very interesting recent speech.  They can nicely be summarised in two cases.

2. Case A. Unilateral tariffs. 

a.      For a given exchange rate (ER).

    i. US demand for UK exports falls. UK activity/inflation fall. 

    ii.  but, offset by foreign producers who divert cheap goods to UK.  Inflation falls. Raises real incomes, but bad for UK firms, so activity effect not clear.

b.     But the ER might change. 

                                                              i.      U US $ should appreciate, so £ depreciates relatively.  this helps UK imports to raise. good for activity.

                                                            ii.      but falling £ raises UK import prices so raises inflation. 

3. Case B.  Responses to tariffs 

    a. more tariffs everywhere raise prices.  inflation rises

b.  but more tariffs lowers demand, so inflation falls. 

c. lower demand everywhere likely has $ depreciate.  Stronger £ means lower inflation.

4. The ECB-G model gives the outcome. 

    a. output and inflation rise initially.  This is because the ECB model has a fast-moving ER channel that dominates, so £ depreciates and there is trade diversion.  Thus import prices rise and so inflation rises.  There is also trade diversion, which lowers inflation and monetary policy reacts.


Now, the 

5. now consider the case of a response.  here all countries respond, activity falls and the US $ likely falls. 

Now we get the opposite effect


with falling output and inflation. 


6. what might happen to adjust these scenarios?  Megan considers: 

a. supply chain disruptions might lower feasible supply, pushing up on inflation

b. a flight to safety might make the $ appreciate.  This is important in the ECB model which she says is dominated by the exchange rate

c. monetary policy is endogenous and passes quickly through to inflation and output.


To summarise, my understanding of this is that it looks like:

a. the SR effects in this model are driven by ERs and a bit of trade diversion.  The longer term effects by monetary policy. 

b. in both cases, trade diversion lowers inflation and is uneven for activity.  Weaker demand lowers both.  

c. But with unilateral, $ appreciates and retailation, $ depreciates.  

There is a nice table summarising


with the ER movement row the crucial one. 

My comment would be

1. the longer run effects of supply are neutral in most models

2. the effects on goods import prices work thru most models quickly but take a time to play out. 

3. the Bank is limited in what it can do on lowering rates since core inflation is high.  If that remains high, then high goods inflation will cause the inflation target to be overshot even more.  Low goods inflation will hide this underlying service sector problem.  That low goods inflation seems likely to be fed by trade diversion.  

4. Broadly, so far this year the $ has got weaker and the £ stronger.  This bears down on UK inflation. 


Tuesday, 22 April 2025

What is a log point? 100*ln(new/old).

 Nerdy. Often when doing growth in Economics, we use change in natural logs.  For a change to y from x, the log point change = 100*ln(y/x).   So a change of 1 in the natural logs, which we often call "1%" is 100 log points.  

If a dataseries rises from 100 to 100.5, then: 

a. the % change is 0.5%

b. the change in the natural log is 0.0049875

c. the change in log points is 0.49875


If a dataseries rises from 100 to 101, then: 

a. the % change is 1%

b. the change in the natural log is 0.00995

c. the change in log points is 0.995


A basis point is defined as: 1bp is 0.0001 = 1/100th of 1%.  Or 100bps are 0.01 = 1%.  One might be tempted to say 0.995 log points are 99.5 basis points, but that's not often done.

Monday, 24 March 2025

Planning again

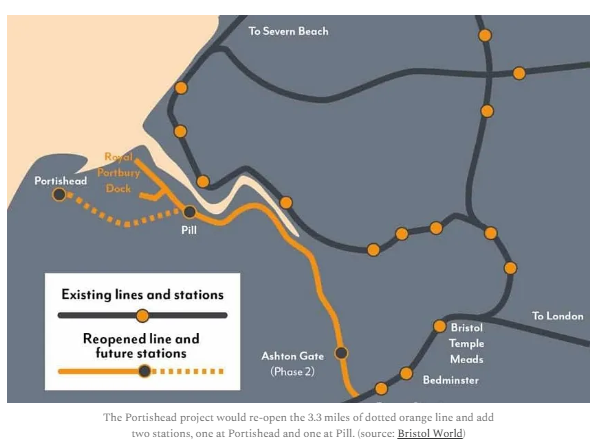
 The brilliant Sam Dumitriu,  points us to the Bristol and Portishead rail link.  from a brilliant piece by Ben Hopkinson. 

The project would reopen 3 miles of line closed by Beeching.  So lots of material is already there.  Note only 3 miles of line.  

He writes:


"The joint local transport plan reserved £1m to study the project in the late 2000s, and Network rail announced a feasibility study on re-opening the line in 2009. 


Public consultation took place in 2015, and Chris Grayling, then Transport Secretary, announced £31m of funding for the line in April 2019 (when the line was meant to open by 2021).


With this funding confirmed, the North Somerset Council began work on its planning application.


In total, the application and all the associated documents come out to 79,187 pages. 

  1. If you printed that out, end to end, there’s 14.6 miles of paperwork, more than 4 ½ times the length of the line that is to be reinstated.
  2. Within those nearly 80,000 pages, there are 17,912 devoted to the environmental statement. That’s 3.3 miles of paper trying to determine if rail transport is good for the environment. 
  3. There’s 1,174 pages devoted to bat technical appendices, 215 to newts, and 1,810 to vegetation management.
  4. It then took three years for the transport secretary to approve the planning application. This is all to replace the existing, derelict tracks with new rails and add two stations in communities that are desperate to have a rail link. "

This is what I could find on this: here. 
Here are some highlights , on a quick search


From the Bat technical appendix:
I have emboldened some of the findings.  
1. Notice there are no bats living on the line,  but they might want to live in nearby trees.  
2. Notice in particular that bats might want to travel on the line.   So it's bats above people.

Bat activity surveys recorded 13 species on the disused railway line with notable species being lesser and greater horseshoe bats (Rhinolophus hipposideros and R. ferrumequinum). The disused railway line is a prominent feature within the landscape between Portishead and Pill and provides a link between semi-natural habitats and foraging areas for bats. The study confirms that it provides an important corridor for movement by bats and a radio-tracking study of one male and one female greater horseshoe bat to Brockley Hall Stables Site of Special Scientific Interest (“SSSI”) identified use of the railway line by the North Somerset and Mendip Bats SAC bat population. Statistical analysis of greater horseshoe bat activity shows that activity was highest at the western end of the disused railway line in the Portbury Wharf area and activity peaked in June. The disused railway line is an integral part of a permeable landscape for lesser and greater horseshoe bats and provides a corridor for movement west of the Avon Gorge Woodlands SAC that is evaluated as being Regionally important.

There are no large communal roosts on the disused railway line, but three day roosts of low conservation importance for local bat populations were confirmed because low numbers of common and soprano pipistrelle bats (Pipistrellus pipistrellus and P. pygmaeus) roost in bridge structures. There are no confirmed tree roosts on the disused railway line, but evaluation of the tree roost resource identified four trees of high bat roost potential and seven trees with moderate bat roost potential. 6. Four tunnels on the Portbury Freight Line, three of which are within the Avon Gorge Woodlands SAC, have been assessed for summer, autumn and winter roost activity. Three of the tunnels have been confirmed as being used by low numbers of bats as summer day roosts and for winter hibernation, with lesser horseshoe, common pipistrelle, serotine (Eptesicus serotinus), Daubenton’s (Myotis daubentonii), brown long-eared (Plecotus auritus) and (probable) natterer’s (Myotis nattereri) recorded. Although not confirmed roosting, barbastelle bat (Barbastella barbastellus) was regularly recorded in one tunnel (Sandstone) during winter 2018, which indicates possible hibernation in, or close to the tunnel. The tunnels are not considered to be important swarming sites, but surveys in autumn recorded social activity and bats appear to use the shelter of the tunnels whilst socialising. Clifton tunnel no. 2 and Sandstone tunnel are the most important roost sites and are assessed as being local (district) value. There are also small lesser horseshoe bat roosts at Pill Station on the Portbury Freight Line that have been evaluated as local value


Wednesday, 5 March 2025

Index numbers and base year weights

 Crafts and Harley have a neat guide to some index number problems.

1. they imagine an economy with 

Year o: 10 bricks at 1 (io% of current value added) 

5 cakes at i 8 (90%) 

Year 2: 20 bricks at 2 (20%) 40 cakes at 4 (8o%)


2. what is growth in this economy?

3. the issue is this

a. we have physically more bricks and more cake.  you can see this with the Quantity ratios, 20/10= 2 and 40/5 = 8

b. but the relative prices of each have changed, such that shares in value added has changed.


4. weighting by the year 0 value added shares (2.7% and 97.3%), we have growth of 7.4.

5. weighting by the year 1 value added shares (50% and 50%), we have growth of 0.2. 

the former is a Laspeyres, the lattter a Paasche.  The Laspeyers is faster. 

Tuesday, 25 February 2025

Trade and Trump

 A brilliant podcast with Martin Wolf and Richard Baldwin.  "

Martin Wolf talks to Richard Baldwin: What’s the future of global trade?

Is technology making tariffs redundant?


Richard makes some brilliant points.

1.      There are three phases of globalisation: All of which are essentially the separation of the production of commodities from the consumption of commodities.  Food is an obvious example. 200 years ago a large fraction of the British population worked on the land. Now, hardly anybody works on the land yet we managed perfectly well to feed ourselves.

2.      The first phase was trade in goods.

3.      The second phase was trade in production.

a.      In the second more subtle phase what happened was there was a massive outsourcing of production mostly manufacturing to low wage countries Who were much more competitive at labour intensive tasks.  We we are now in a position as a consequence of this the China manufacturers around 30% of world manufacturing. Unscrambling this of course will be quite painful, and notice that much of this manufacturing is in turn intermediate goods which go to other countries.

b.     The fact that so much of this is intermediate goods is an important consequence for Mr trump's tariffs. In the early days of the USA The US manufactured hardly anything and imported vast quantities of goods. Tariffs on goods therefore raised an awful lot of money, at some cost of course to the living standards of American consumers.  Now with so much trade in intermediate goods putting a tariff on an import is simply punishing yourself.  Baldwins view is that ultimately this economic logic will mean that the worst of tariffs will be watered down.  He also pointed out interestingly that Biden was much more selective in his use of tariffs, for example on semiconductors, perhaps to build up US manufacturing capability for national security style reasons. Noah Smith has also put forward this interpretation.

4.      The third phase is yet to come, and that is trade in services. Or as Martin wolf puts it dramatically, we started with trade in goods, then we had trade in factories, now we have trade in offices.

a.      One point about service sector trade is that it's very difficult to put a tariff on it. If somebody in India helps me with my PowerPoint slides it's almost impossible to put a tariff on that. Likewise as they point out, since Richard Baldwin is sitting in Zurich, the podcast they were making is in fact (nonmonetary) trading services. Impossible to know how one could put a tariff on that.

b.     They then make the point that such trading services is potentially competition for a lot of middle class jobs. Martin wolf made the point that radiographers elsewhere in the world can probably look at X-rays perhaps better then native radiographers.

c.      It further follows that once machines get even better at doing all of this then trade is possibly only a secondary force.

d.     On a slightly more technical issue, Richard Baldwin made a very nice point about the OECD services trade restrictiveness index. The interesting point about this index is it shows a lot of variation across countries, when it seems very hard to actually Put tariffs on services. Richard Baldwin made the very nice point that this restrictiveness index is essentially an index of the difficulty of business to consumer trade. Much of services trade however might be business to business trade, which is not captured by the index.

Martin Wolf talks to Richard Baldwin: What’s the future of global trade?

Is technology making tariffs redundant?

Martin Wolf talks to Richard Baldwin: What’s the future of global trade?

Is technology making tariffs redundant?


Wednesday, 19 February 2025

Defence spending: getting a sense of the numbers

 1. If we have to spend more on defence, what is the scale of those numbers?

2. The ever brilliant IFS have a "what does the government spend money on" guide. 

3. The picture is this: 


4. and the (round) numbers are this. 

5. Total spending 22-23 is £1,200bn.  We have (again in round numbers)

   a. NHS spending: 200bn = 20% of total

b. Education: 100bn = 10%

c. Defence 50bn = 5% 

d. Public order = 40bn, 4%

e. Transport 40bn = 4%

f. net debt interest 100bn, = 10%.


6. Total GDP in 22-23 was 2.6tr. So 1% of GDP is 26bn, 0.1% of GDP is 2.6bn (a basis point of GDP is 260m).  If we currently spend 2.3% of GDP on defence and want to increase that to 2.5% of GDP, that is a rise of 0.2 pp of GDP whiich is about 5bn.  That's about 12% of transport or public order, or 5% of Education. 

Friday, 7 February 2025

Do monetary incentives crowd out pro-social behaviour

 1. This has always struck me as a potentially important critique of standard economic assumptions.  The ever brilliant Chris Dillow notes this is a problem with using market mechanisms.  As he says


This problem is exacerbated by another: motivation crowding out. Who is likely to be the better probation officer: the one drawn to the profession by a desire to rehabilitate offenders; or one who will earn a little more for hitting a contractual target? Who is likely to better look after vulnerable children: someone attracted to work in childrens' homes by a love of children; or one working for a profit-maximizing private equity firm? If the cash nexus comes to dominate, other motives such as professional pride recede not just because people change but because those with strong professional ethics simply leave the job.


2. The paper he links to is Bowles  and Reyes.  They nicely use a Lucas critique argument

"Here we extend the logic of the Lucas Critique to questions of framing, motivations, and social norms, in short, to preferences. To do this we modify the standard public economics and mechanism design assumption that taxes, subsidies, and other explicit incentives affect behavior only indirectly, that is by altering the economic costs and benefits of the targeted activities. In this conventional approach explicit incentives thus do not appear directly in the citizen's utility function and as a result, the behavioral effects of explicit economic incentives and social preferences are separable, the effects of each being independent of the levels of the other. We modify the citizen’s utility function so that this separability property need not hold and as a result the two kinds of motivations may be either complements -- social preferences being heightened by incentives appealing to self-interest -- or substitutes, when explicit incentives are said to crowd out social preferences." 

As they say there may be other reasons 

 Incentives may have counter-intuitive and counter productive effects for reasons other than non-separability (Seabright (2009)).


Strong monetary incentives, for example, may overmotivate an agent leading to greater than the optimal level of arousal posited by the so called Yerkes-Dodson law. This appears to be the mechanism underlying the negative effects of high incentives found in three experiments by Ariely, et al. (2005).


Similarly, if agents have an income target, monetary incentives may allow target attainment with less effort. Camerer, et al. (1997) suggest that this may explain why New York City taxi drivers work fewer hours when they are making more per hour. 

and they add the possiblity that just setting a target might signal how hard the achievement is:


the target may also infer information about the person who designed the incentive, about his or her beliefs concerning the target, and the nature of the task to be done (Benabou and Tirole (2003), Fehr and Rockenbach (2003)).


3. Dillow's earlier blog post on Ronnie O'Sullivan is a fantastic summary.  


Monday, 3 February 2025

Intangibles and Industry Concentration

 Very pleased to see this article.  Why has industry concentration risen? Because of intangibles....

Intangibles and Industry Concentration: A Cross‐Country Analysis

 Matej Bajgar, Chiara Criscuolo, Jonathan Timmis


"This paper presents new evidence on the growing scale of large businesses in the United States, Japan and 11 European countries. Itdocuments a broad increase in industry concentration across the majority of countries and sectors over the period 2002–2017. Therising concentration is strongly linked to investment in intangibles—particularly innovative assets; and software and data—andthis relationship is magnified in more globalised industries. The results are consistent with intangibles disproportionately bene-fiting large firms, enabling them to scale up and increase their market shares by leveraging intangibles across multiple markets." 


Here's the key chart