A draft working paper with Josh Martin. Comments welcome.
Economic inactivity and the labour market experience of the long-term sick
A draft working paper with Josh Martin. Comments welcome.
Economic inactivity and the labour market experience of the long-term sick

The latest ONS business investment data, chained volume indices show
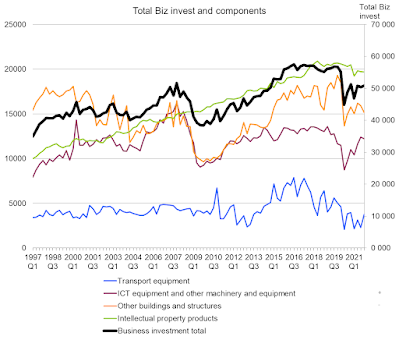
What do we make of this?
1. Overall investment took a beating in the financial crisis, then recovered. But it stalled again post the 2016 Brexit referendum. It collapsed in the pandemic, and has not recovered.
2. The lack of recovery is mainly due to the fall in buildings, which has hardly recovered at all.
3. IPP and ICT investment has stayed flattish and recovered respectively.
4. Transport equipment, which is very volatile anyway has continued on a downward trend.
5. Over the longer term, the constant is rising IPP investment. ICT investment is not even back to pre-financial crisis levels. Buildings is back to 1997 levels.
As this paper nicely points out, Shimaa Elkomy et al, "Energy and Productivity, A review of the literature" https://cusp.ac.uk/wp-content/uploads/pp-energy-report.pdf#ppem, the explanations seem to be rather the same:
"For example, in 1966 Cambridge economist Nicholas Kaldor pointed to (and rejected) a number of common explanations for the UK’s declining productivity growth. Many of these reappear in the UK government’s recent industrial strategy (Table 2). Either we have made little progress in tackling these issues in the intervening half century, or we have missed a key element of productivity"

BEIS (2018) Industrial Strategy: Building a Britain Fit for the Future. Available at: 78 | CUSP WORKING PAPER No 23 https://assets.publishing.service.gov.uk/government/uploads/system/ uploads/attachment_data/file/664563/industrial-strategy-whitepaper-web-ready-version.pdf (Accessed: 29/04 2018)
Happy to have done a Tuck/Dartmouth college panel on this. Here's some data from Pol Antras on "slowbalisation" https://scholar.harvard.edu/files/antras/files/deglobalization_sintra_antras.pdf
a. "The world trade‐to‐GDP ratio – a standard measure of globalisation – has recovered from its late 2008 low, while last year, the share of migrants in world population attained its highest level since 1990
b. Concerning the ratio of world trade to world GDP in the last
fifty years, 1970-2020
i.
The ratio of world trade to world GDP
almost doubled (increasing by a factor of 1.72) during that period of
“hyperglobalisation”.
ii.
I find that 80% of the growth in this ratio
occurred during the subperiod 1986‐2008. (Why? Combination of ICT, fall of communism, China, shipping
costs falling)
iii.
Because many measures of globalisation are
simple ratios or shares that have natural upper bounds, I argue that growth
explosions in trade openness of the type experienced during the
hyperglobalisation of 1986‐2008 are simply not sustainable. In other words, a
period of “slowbalisation” was inevitable."
Here's his figure 1

This 2014 paper on cost pass-through is a nice summary.
Our discussion of relevant theory is framed in terms of absolute pass-through: the degree to which a given absolute change in cost causes an absolute change in price
The extent of industry-wide cost pass-through in a perfectly competitive market depends on the elasticity of demand relative to supply. The more elastic is demand, and the less elastic is supply, the smaller the extent of pass-through, all else being equal
With other market structures, economic theory indicates that:
– Pass-through depends on the curvature of demand. It is greater with convex inverse demand (the inverse demand curve becomes steeper as output decreases) and smaller with concave inverse-demand (the inverse demand curve becomes flatter as output decreases), all else being equal.
– Pass-through is smaller when marginal cost curves slope upwards (i.e. marginal cost increases as output increases) and greater when marginal cost curves slope downwards (i.e. marginal cost falls as output increases).
– Pass-through in excess of 100% is possible when inverse-demand is convex enough and/or when there are strong increasing returns to scale such that marginal cost curves slope sufficiently downwards. Industry-wide cost increases can result in increased profits when demand is very convex.
Many theoretical models indicate that pass-through of industry-wide cost changes increases with the intensity of competition1 , provided that inverse demand is not very convex,
The paper usefully illustrates some examples of industry curvature.

"Suppose that a monopolist faces an increase in its unit costs. The monopolist will consider its scope to adjust its price upwards.
The monopolist will think: “how much output do I have to sacrifice to pass on a certain amount of this change in my costs?” If the answer is “very little”, passing on the cost shock will be more attractive; if the answer is “a lot”, passing on the cost shock will be less attractive. The answer to the monopolist’s question is related to the curvature of demand. Other things being equal, pass-through will be lower if inverse demand is concave (because passing on the cost increase will cause a relatively large fall in output). On the other hand, pass-through will be higher with convex demand (since passing on the cost increase has a smaller impact on volumes)."
A useful formula in Genakos, 2019, summarises this.

where
special cases

An interesting Productivity Institute meeting today on supply chains.
One of the features discussed about
the UK productivity puzzle is under the heading of “supply chain management”. Maybe British supply chain productivity is
very low. Maybe British supply chain productivity is not resilient enough, see COVID
and issues around Chinese involvement in 3G technology for example. so how should we think about supply chains?
How should we answer questions about whether supply chain management is or is
not adequate?
Let's start with an example. Suppose we have three types of law firms.
1. Law firm 1 employes a building, a receptionist,
an operations manager, and a load of lawyers. The process within the law firm consists of
the following. The client comes into the
building and is greeted by the receptionist who then takes the client up to the
lawyer. The lawyer gives the client an
opinion , and the client pays and walks away.
The operations manager designs the process by which the receptionist takes
the client up to the lawyer (offering them tea, helping with directions to the next
appointment etc.) Notice, the client
never sees the operations manager, and although the client sees the
receptionist, neither the receptionist nor the ops manager is a trained lawyer.
2.
We then
have some definitions as follows:
a.
Industry. the law firm is in the law industry because
its output is legal services.
b. Process. The visible processes which the
law firm is involved in consists of the process carried out by the receptionist
and the process carried out by the lawyer.
c. Activity.
The law firm is in fact involved in three different activities:
i.
the
provision of reception services,
ii.
of
operations services ,
iii.
and
legal advice.
d.
Lots
of the lawyers in law firms moan endlessly about the fact that out of their
fees comes the expenses of the receptionists and the operations managers, none
of whom know anything about the law. Likewise academics who complain about
administrators and admission staff who know nothing about academia, footballers
who complain about groundstaff who can't play football etc.
3.
now
consider law firm 2. They have contracted out reception services to a separate
firm, who has simply bolted a flat screen TV screen to the wall of the front office
and provides receptionist services remotely.
4.
Now
consider law firm 3. They have also contracted at reception services, but they as
well they have contracted out operations management to a management consultant.
the management consultant as supplied them with the book setting out a set of
routines to which, let us say, the receptionist adheres, when taking the client
up to the lawyer.
What can we say about
productivity and the adequacy or otherwise of supply chain management in these
examples?
1. Let's start with the definition of a
supply chain. Law firm one has an entirely internal supply chain, in this case the
process by which the receptionist hands over the client to the lawyer. That
supply chain is presided over by the operations manager. Law firm three has a supply chain, but it is
external. That is to say, the services provided by the receptionist and by the
operations manager in simply bought in externally.
2. Going back to the activities that are
involved, in firm one the operations manager provides operations advice
services, but this is done internally. If one had the management accounts for
this firm, and one could figure out the wages and overhead costs of the
operations manager, one could therefore figure out the costs involved in the
provision of those advice services. In case 3 the matter is much easier; one
just looks at how much the firm is paying to the management consultant.
3. What about measuring productivity? there
would seem to be two methods:
4. method 1. Process.
a. In law firm one, break up the firm into
the different processes that are involved. Try to measure the productivity of
each process. So there will in practise be two output measures; first, the output
of the reception process, and 2nd the output of offering legal advice after the
client has been through the process of reception.
b. In this case, one would have to try as
well to allocate costs such as the operations manager into each process. This
of course it's much easier to do in the case of law firm 3 since every part of
the process is transacted for. Thus there is going to be an observable price and
quantity for the entire provision of legal advice.
5. Method 2.
Activity.
a. For every law firm count the output as the
provision of legal advice, so there is only one measure of output. However, account
for the fact that different law firms undertake different activities, and these
activities might potentially contribute to productivity. In each of the
examples the activities are (a) reception activities, (b) giving-legal-advice-activities,
and (c) operations activities.
b. Although measuring the activities is hard,
by taking an activities rather than a process approach, one avoids the almost
impossible problem of subdividing the output of legal advice into lots of
different processes. Indeed, in many law
firms , who keep time sheets of chargeable hours, it might very well be
feasible to gather data on the activity, because it is the different activities
that are documented on the charge sheets (for example many charge sheets might
categorise the activities of being with clients, marketing and customer
acquisition, personnel and administration).
c. This activity approach would, under certain circumstances, count the knowledge of the ops manager as an intangible asset. For more on intangibles, see here.
6. (Finally, an overall point on the economic
modelling of all of this. As Milgrom,
Roberts and others Have pointed out, economists have a very stripped down model
of the firm. When economists write down what is called a production function, they
assert, on the face of it quite sensibly, the output is produced by capital and
Labour. What many supply chain managers and the academics who study them will
tell you is that production requires as well coordination activities. Economists
tend not to bother modelling these coordination activities separately. They are
either included in labour, or viewed as being small enough for one to ignore.)
In our work on intangibles, we keep stressing that it is broader than R&D. Here's some evidence .
" Research comprised a telephone survey of 625 respondents across nine creative industry sub-sectors and was undertaken before the COVID-19 lockdown."
"This report considers R&D in the creative industries using two existing definitions: the broad OECD Frascati definition, used in official international surveys, and the definition used by HMRC for tax credit purposes. More than half (55%) of firms had undertaken R&D using the broad Frascati definition but only 14% had done so using the definition for tax. IT, software & computer services firms were the most likely to have conducted R&D activity under either definition (71%), with museums, galleries & libraries least likely (27%)."
In more detail, firms were asked a broad and narrow definition of R&D. Here's the questions and the answers:


AI evidence to the All Party group on AI. Evidence pack here.
Notes on WFH
This has become super popular in the literature. Let’s be careful not to get overexcited, and,
for those who are in the professional and white collar sector, not to
extrapolate too much from their own personal observation .
The ONS publishes data on working from home in their fantastic
Business Impact of Coronavirus (COVID-19) Survey (BICS). Here are weighted
results from Wave 16, link being:
and specifically
The table below shows some of the key figures. They start in
column one and column 2 by asking firms whether more or less of their workers
are working from home, referring to the week 5th -1th October. Perhaps
not surprisingly 26% on average in all industries of workers are working more from
home, although 75% report no increase in working from home. Notice that the
biggest increase in the number of workers working from home is in the water and
sewerage industry , at 85%. Even in manufacturing, where you would imagine
working from home would be rather complicated, 24% more workers are working
from home.

A snapshot of working from home may not be very informative.
Perhaps it's of more information therefore to ask firms whether they expect not
working from home will be a permanent feature. This is set out in columns 8 and
9 (with 10 for not sure). In column 8 we can see that 17% of all industries 17%
expect working from home to be a permanent feature of their business model. 65%
do not expect it to be the case and 17% don't know. Returning to the
water industry only 2% of firms expect this to be a permanent feature and 93%
of firms expected not to be the case.
Notice that there are really only three industries which stand
out as expecting working from home to be a permanent feature: information and
communication and professional and scientific and education. There is fairly
clear blue water between the numbers in those sectors, 37 percent, 34% at 28% and
the other sectors. This immediately
suggests that perhaps the discussion of working from home might be dominated by
the bias of those people who are typically writing about it.
Finally, we may look at the consequences of working from
home for productivity. These are in columns 4,5 and 6. Perhaps the most
striking result is how balanced these results are. Around 60% of firms think
that productivity will be the same 19% of firms think that productivity will go
down , and 14% of firms think the productivity will go up. Once again the numbers who think productivity
will rise are concentrated in a rather small number of industries most notably
46% in information and communications and 52% in other services. Professional scientific and administrative have
numbers at around 10% but otherwise none of the other industries have a
particularly strong expectation of an increase in productivity.
Finally the scatter plot summarises some of these numbers. The
vertical axis is the number expecting long run increase in WFH less those expecting
long run decrease. The horizontal axis we have the net numbers in the
industries who expect productivity to increase .

As we see in the scatter, the bulk of the industries are at
the bottom left. There is some small expected increase in the numbers working
from home, but productivity or net is anticipated to be lower. Rather few
industries are in the top right where productivity is expected on net to
increase and there was to be substantial more working from home. These are
dominated essentially by ICT , other services and professional scientific and
technical, where there is expected to be, on net a slight loss in productivity.
Notice finally the all industries: on 48%
more firms expect less WFH then expect more WFH and 5% more of firms expect
productivity to fall.
Update:
Finally, ONS also ask business who say they will have more (less)
working from home why they intend to do so (not to do so) . Of businesses not intending, 91% say that’s
unsuitable for their business. Of those intending, we have
a.
64% say lower overheads
b.
61% improved staff wellbeing
c.
40% increased staff productivity
d.
22% ability to recruit from wider pool
e.
18% reduced sickness
f.
11% better able to match jobs with skills
