Paul Krugman points us to Chapter 3 of the IMF World Economic Outlook entitled The Good, the Bad, and the Ugly: 100 Years of Dealing with Public Debt Overhangs". It's really good. Here's my take on it.
1. Public debt has reached very high levels

2. So what's to worry about? The worry is getting on an unsustainable path so that the stock of debt relative to GDP rises too fast. here's the formula that tells you how it evolves and so how to get it down:

where
b=Debt/GDP ratio
i = interest on the debt
pi=
 = inflation
 g = real GDP growth rate
d= primary deficit-to-GDP ratio.
and e an error due to accounting adjustments and the like (ignore this).
What do we learn from this? I find it more instructive to write this as the change in b so we can see directly how the change in debt/GDP evolves. this gives
change in b= (i-
-g)/(!+i-+g)b(t-1)+ d+ e (ignoring some terms in g). The bottom line of this is very close to 1, so let us write it as
So what? Have a look at the co-efficient on b(t-1), the first bracket.
a. As a matter of maths, if the bracket very large then the change in b depends very much on last year's b. That's bad: it says, the more debt you had last year, the bigger the increase this year. This comes from the effects of interest that accumulates the debt burden and growth that relieves the debt/GDP ratio.
b. If in fact the top line is zero, that would be good. Last years' debt would have no impact on debt growth. So the only thing that drives Db would be the deficit, if one controlled that all would be well.
c. As a matter of data it turns out that over most periods, guess what, the top line is zero. That is to say, the real interest rate typically is about the growth rate. Indeed, in good times, the real interest rate is below the growth rate, and so the debt burden can be cut just thru growth.
d. all this shows cutting the debt burden can happen in a number of ways
- low real interest rates. in turn that means
- low nominal interest rates and/or
- high inflation. So you can see the scope for surprise inflation getting rid of the debt.
- high growth
- low primary deficit

The top left is the UK between the wars. They pursued a very tight money policy with high interest rates, lowed spending all in order to try to deflate their way back to the gold standard. As the low blue panel shows, cutting spending did some of the work. But tight money raised the interest rate, and low inflation meant high real interest rates, and all that worked against the reduction programme. As did very slow growth.
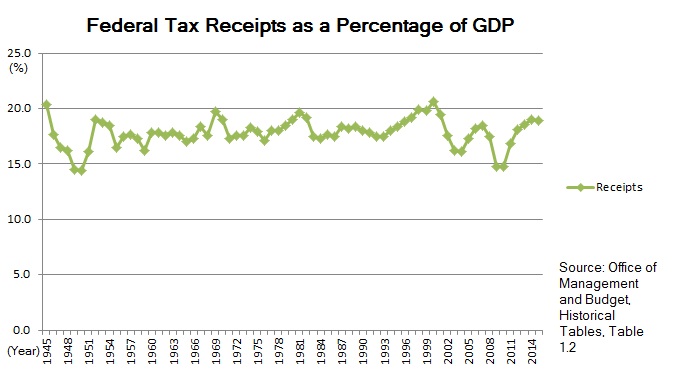
Other countries have been trying different ways. The US in the 40s+ did it by inflation and some growth. The Japanese are not cutting spending etc.
What do the IMF conclude?
For countries currently struggling with high public
debt burdens, the historical record offers both instructive
lessons and cautionary tales.
The first lesson is
that fiscal consolidation efforts need to be complemented
by measures that support growth: structural issues need to be addressed and monetary conditions
need to be as supportive as possible. In Japan,
for example, weaknesses in the banking system and
corporate sector limited monetary policy efficacy and
led to weak growth, which prevented fiscal consolidation.
As a result, debt continued climbing until these
issues were addressed. In Italy, Belgium, and Canada,
debt did not fall until monetary conditions were supportive.
Here, reforms to wage-setting mechanisms
that broke the wage-price spiral were an important
contributor to the establishment of the supportive
monetary environment. Furthermore, monetary easing
also fostered exchange rate depreciation, which
supported external demand and growth.
The case of the United Kingdom reinforces this
message but also offers a cautionary lesson for countries
attempting internal devaluation. The combination
of tight monetary and tight fiscal policy, aimed
at significantly reducing the price level and returning
to the prewar parity, had disastrous outcomes.
Unemployment was high, growth was low, and—
most relevant—debt continued to grow. Although
the price level reduction the United Kingdom was
attempting to achieve is larger than anything likely
to happen as a result of internal devaluation today,
similar dynamics are evident. A reduction in the
price level, a necessary part of internal devaluation,
comes at a high cost, and determining whether the
cost outweighs the benefit to competitiveness from
internal devaluation requires further work.
The case of the United States, although supporting
the general finding about the contribution of
monetary policy, points to more outside-the-box
possibilities. U.S. monetary policy was very supportive
in the immediate postwar years as a result of limits
on nominal interest rates and bursts of inflation.
This particular combination quickly reduced the
debt ratio while growth remained robust.
A second lesson is that consolidation plans
should emphasize persistent, structural reforms over
temporary or short-lived measures. Belgium and
Canada were ultimately much more successful than
Italy in reducing debt, and a key difference between
these cases is the relative weight placed on structural
improvements versus temporary efforts. Moreover,
both Belgium and Canada put in place fiscal frameworks
in the 1990s that preserved the improvement
in the fiscal balance and mitigated consolidation
fatigue.
A third lesson is that fiscal repair and debt reduction
take time—with the exception of postwar
episodes, primary deficits have not been quickly
reversed. A corollary is that this increases the vulnerability
to significant setbacks when shocks hit. The
sharp increases in public debt since the Great Recession—
including in the relatively successful cases of
Belgium and Canada—exemplify such vulnerability.
Furthermore, the external environment has been an
important contributor to outcomes in the past. The
implications for today are sobering—widespread
fiscal consolidation efforts, deleveraging pressures
from the private sector, adverse demographic trends,
and the aftermath of the financial crisis are unlikely
to provide the supportive external environment that
played an important role in a number of previous
episodes of debt reduction. Expectations about what
can be achieved need to be set realistically.
And the IMF make threee suggestions
Based on these lessons, we suggest a road map for
successful resolution of the current public debt overhangs
First, support for growth is essential to cope
with the contractionary effects of fiscal consolidation.
Policies must emphasize the resolution of underlying
structural problems within the economy, and monetary
policy must be as supportive as possible.
Second, because debt reduction takes time, fiscal consolidation should focus on enduring structural change.
Third, while realism is needed when it comes to expectations about future debt trajectories and setting debt targets in a relatively weaker global growth environment, the case of Italy in the 1990sAll this goes to show how deeply endogenous all these relationships are. To those calling for fiscal expansion, the reply is often "what will the markets think" i.e. that a rise in d might cause a rise in i which compounds the problem. Somehow if we are to have a Keynesian expansion we have to find a way to do it without raising interest rates: some new mechanism by which investor will trust future governments who promise to spend now that they will cut in the future. As ususal then, the answer to our problems is innovation: we need some institutional mechanism that ensures spending either really will be cut later, or that spending does really enhance growth.
suggests that debt reduction is still possible even without
strong growth.
So the most obvious one would be to try for the latter. We have to have a policy that will help us have some growth: the lesson for the UK in the 1930s, as Krugman observes, was that the austerity was undone by slow growth. That says to me that any increased spending should proritise the science budget and the internet (good for growth) and building housing (likewise).
Update.
The always excellent Tim Taylor, Conversable Economist, blogs on this too.
and the Maths of all this are well set out in Ley, 2010, Fiscal and external sustainability.


